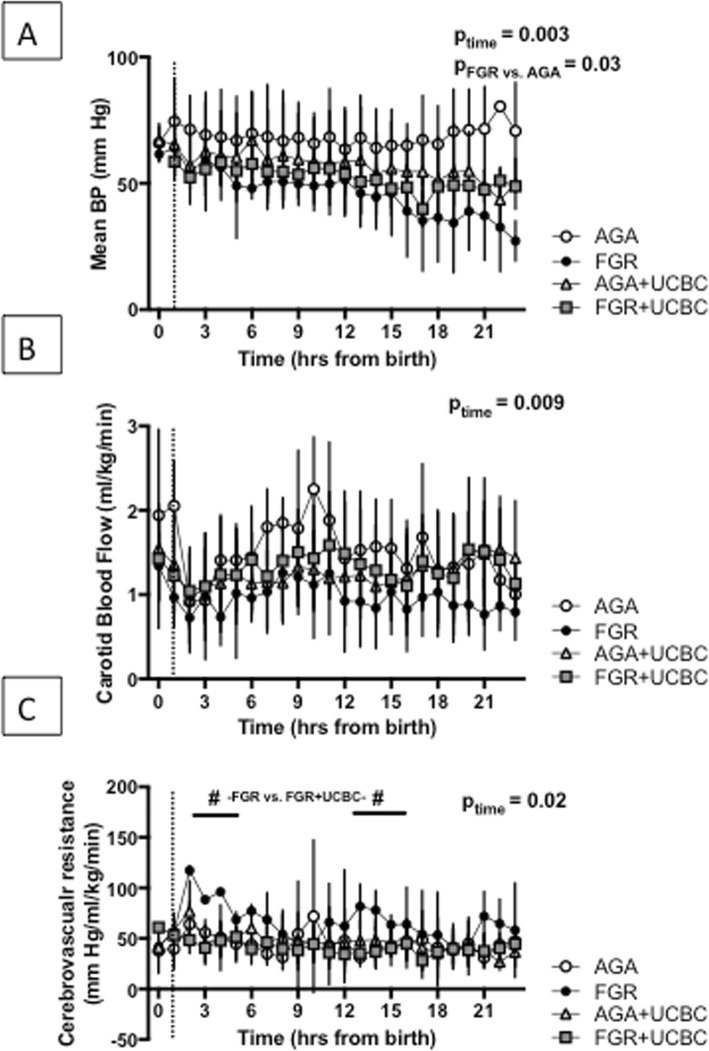
Fig. 1.
a Mean arterial blood pressure (MAP) across lamb groups over the course of the experiment. b Carotid blood flow (CBF) as a surrogate for cerebral blood flow across lamb groups. c Cerebrovascular resistance for lamb groups. Number sign denotes significant differences between FGR vs. FGR+UCBC group at highlighted time points, p < 0.05. Dotted lines denote the timing of UCBC administration; three-way RM ANOVA was applied across all parameters. ptime signifies time interaction; pFGR vs. AGA signifies growth interaction

