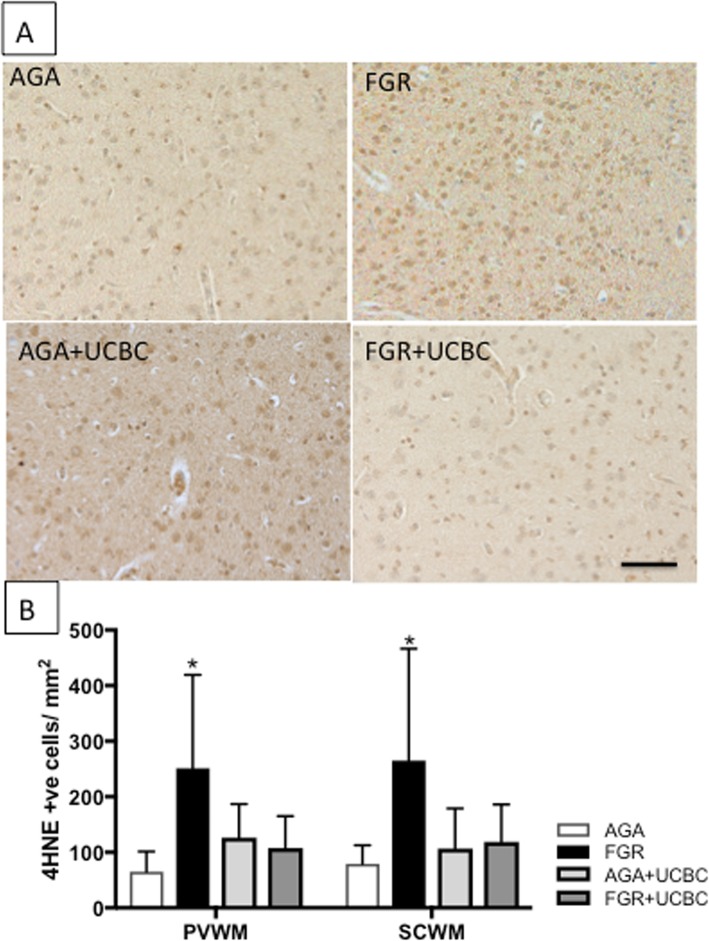
Fig. 4.
a Representative photomicrographs of 4-HNE-positive cells demonstrating oxidative stress in SCWM across groups. b Quantitative analysis of 4-HNE cell counts across white matter brain regions; two-way ANOVA applied. Asterisk denotes FGR significantly different to AGA; significant differences accepted at p < 0.05. All scale bars = 50 μm

