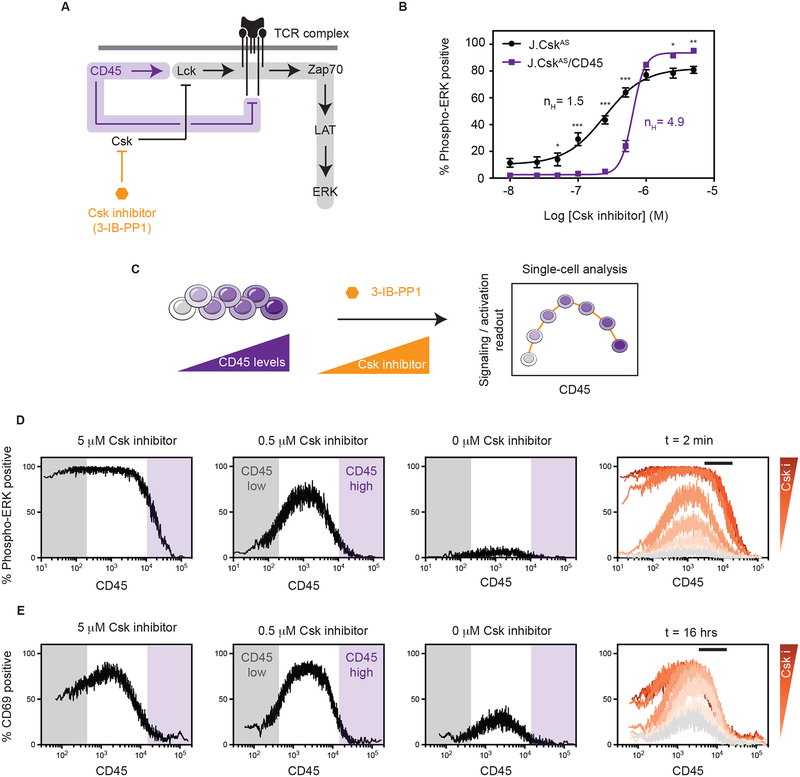
Fig. 4. Titration of CD45 expression unmasks opposing regulatory roles.
(A) Revised model where CD45 acts to both activate Lck kinase but also dephosphorylate its substrate, the TCR complex. (B) The proportion of phospho-ERK positive cells was quantified as an integrated readout of TCR signaling by flow cytometry using a range of Csk inhibition. Error bars represent the means ± SEM (N=3) and * P < 0.05, *** P < 0.001 (two-way ANOVA Bonferroni multiple comparisons test). (C) CD45-deficient cells (J.CskAS/CD45) were transfected with CD45 to generate a broad range of CD45 expression levels. Cells were then treated with Csk inhibitor and assessed by flow cytometry. (D) Analysis of cells with high and low CD45 levels treated with 5 μM of Csk inhibitor (3-IB-PP1) for 2 minutes using phospho-ERK as a readout. The percentage of phospho-ERK positive cells was plotted as a moving average versus CD45 levels over a range of inhibitor concentrations. (E) To assess sustained signaling, cells were treated with Csk inhibitor for 16 hours. The percentage of activated (CD69 positive) cells was plotted as a moving average versus CD45 levels. For (D and E), the far-right panel depicts an overlay of results obtained with different Csk inhibitor concentrations. The black bar denotes approximate WT level of CD45. Histograms can be found in supplementary materials. All data are representative of three independent experiments.

