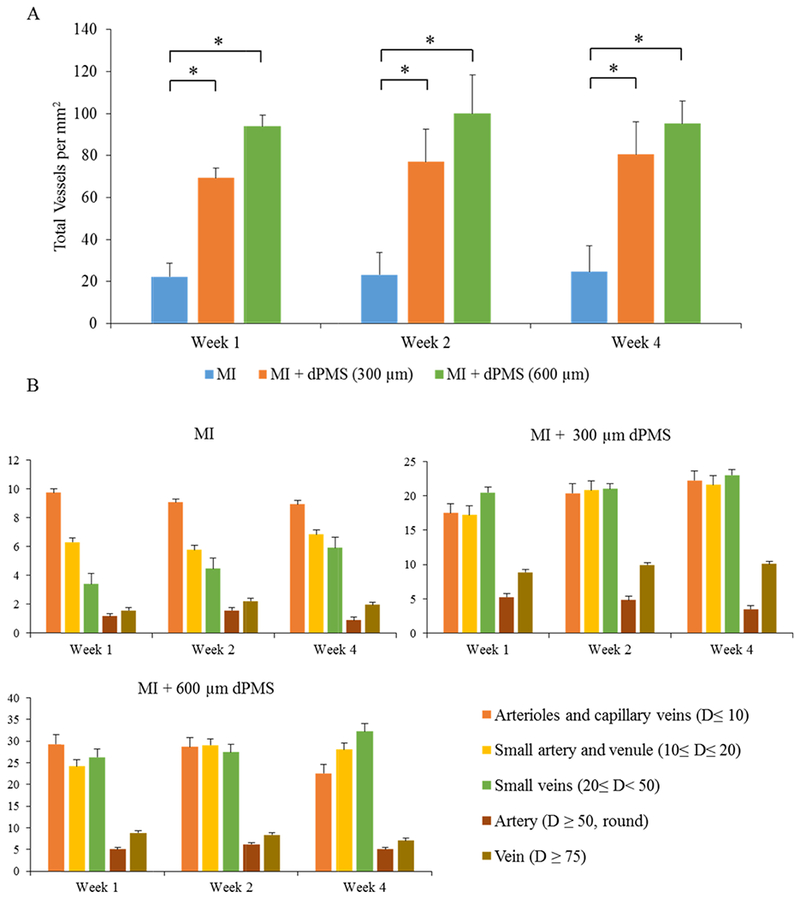
Figure 4.

MI region vessel density and composition analysis. The quantification of total vessels density in the MI region of the treatment and control groups at weeks 1, 2, and 4 post-surgery (A). The composition of different vessel types in the MI region from treatment and control groups is shown at week 1, week 2, and week 4 (B). Data were expressed as means ± SD (n = 6 for each sample). * Represents the statistical significant difference with a p < 0.05. D: diameter.
