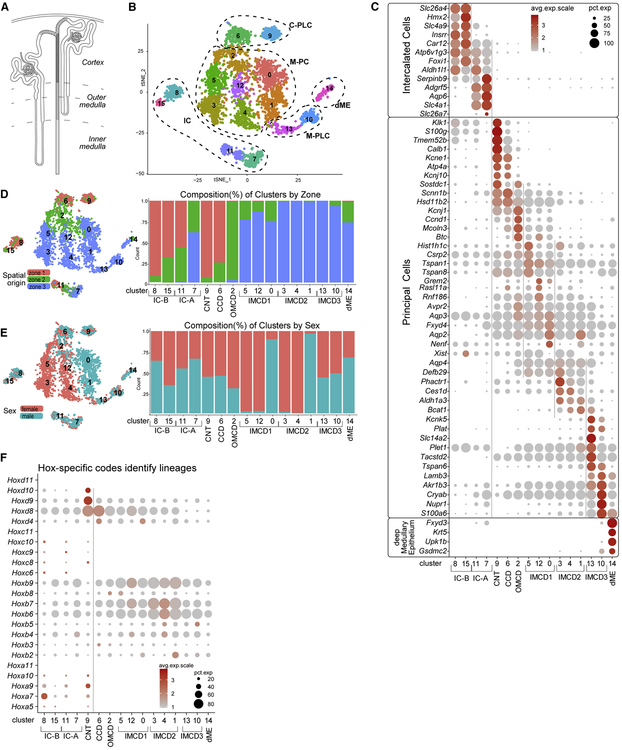
Figure 4. Anatomical, sex and cell diversity of ureteric epithelial groupings.
A, Schematic showing nephron (unshaded) to UE (shaded) transition through connecting segment (stippled). B, tSNE projection of re-clustered UE dataset using cells from primary annotation (green in Figure 1B); C- and M-PLC, cortical and medullary principal-like cells; M-PC, medullary principal cells. C, Dot plots of cluster-enriched gene expression, annotating clusters as intercalated cells (IC) type A and B, connecting tubule (CNT), cortical collecting duct (CCD), outer and inner medullary collecting duct (OMCD, IMCD types1–3), and deep medullary epithelium (dME). D-E, tSNEs and barplots illustrating the distribution (left) and composition (right) of the cell clusters with respect to zonation (D) and sex (E). F, Dot plot summarizing Hox-gene expression across the UE dataset cell clusters. See also Figure S4

