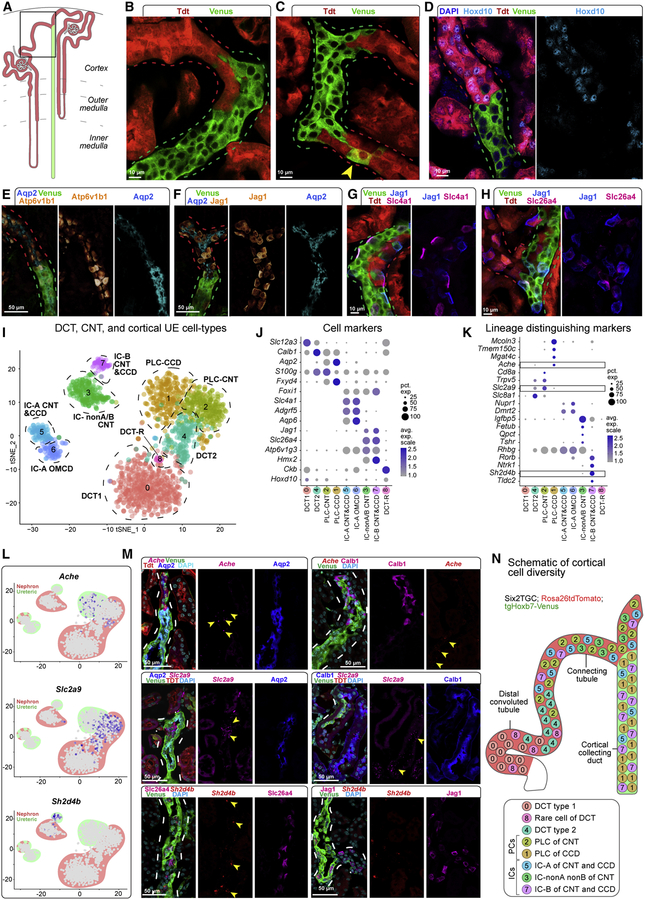
Figure 5. Dual origin for cortical principal and intercalated cell types.
A, Schematic showing nephron (red) and ureteric (green) lineage labeling and region of focus (boxed). B-C, Lineage-tracing identifying nephron connections with the UE; arrowhead, co-labelled cell. D-H, Distribution of positional (Hoxd10), principal (Aqp2) and intercalated (Atp6v1b1, Jag1, Slc4a1 and Slc26a4) cell markers by immunostaining. I, tSNE projection of re-clustered cortical epithelial cell types from N and UE datasets. J, Dot plot of cluster enriched gene expression. K, Dot plot of lineage enriched gene sets; boxes show genes validated by RNAscope in situ. L-M, Feature plots and RNAscope validation of lineage distinguishing cell markers; yellow arrowheads, transcripts; dashed lines, tubule outlines. N, Schematic summary of cell types of the nephron and UE connection. See also Figure S5

