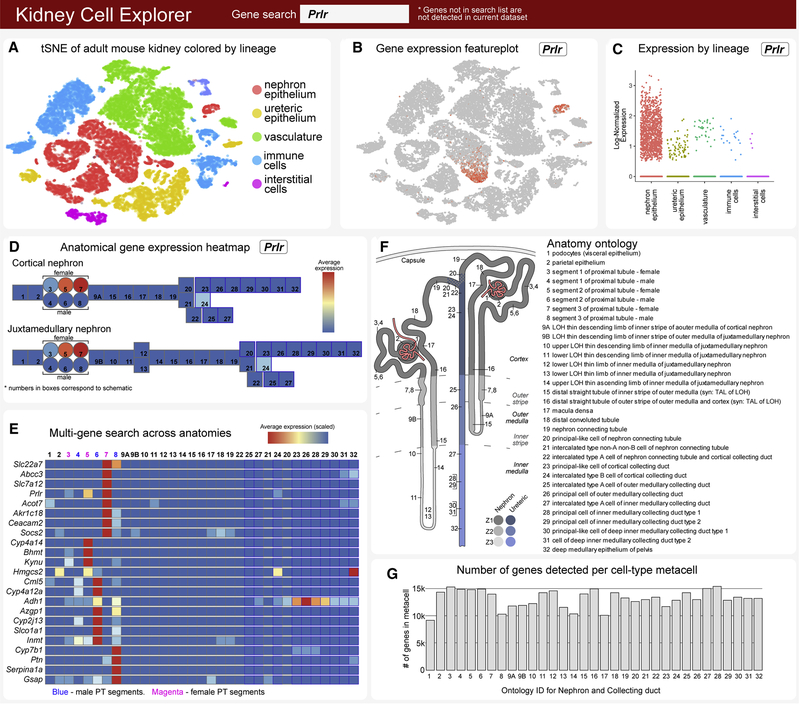
Figure 6. Kidney Cell Explorer views - a searchable map of cell diversity in the adult mouse kidney.
A, Field enabling selection of tSNE plot for whole kidney, nephron or ureteric epithelium dataset views. B, Field producing a feature plot of selected gene in active scRNASeq dataset. C, Field producing scatterplot of selected gene as expressed across sex, spatial origin or lineage in whole kidney dataset. D, Heatmap of gene expression for a single selected gene in metacells arranged as cortical and juxtamedullary nephron models. E, Heat map of gene expression for multi-gene searches in metacells of nephron and collecting duct. F, Schematic map indicating anatomic position and ontology terms for metacells in (D). G, Number of genes detected in each metacell in (D). See also Figure S8

