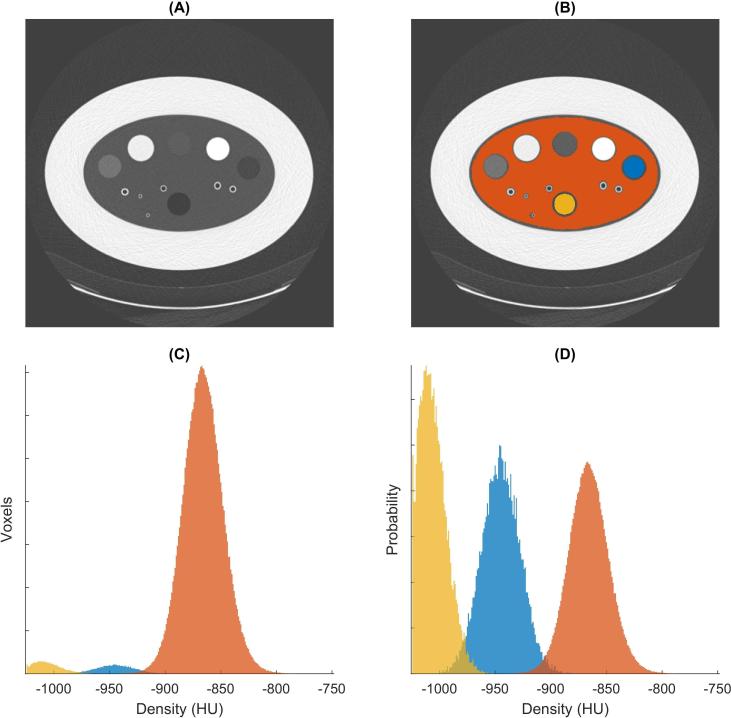
Figure 2.
Steps of calculating overlap in density distributions. (A) Transverse CT image (120 kVp, 20 mAs, Br40, FBP, no NiTANN applied), (B) shows the same CT image with the LabelMap overlay (lung-like material in orange, air insert in yellow, emphysema-like insert in blue). (C) CT density histogram for voxels with lung, air and emphysema, same color scheme as in (B). (D) Normalized histograms (i.e. the total area of each histogram was made the same). The overlap between emphysema and lung (blue and orange) was 2.5% in this case. FBP, filtered backprojection; NiTANN, non-iterative technique artificial neural network.

