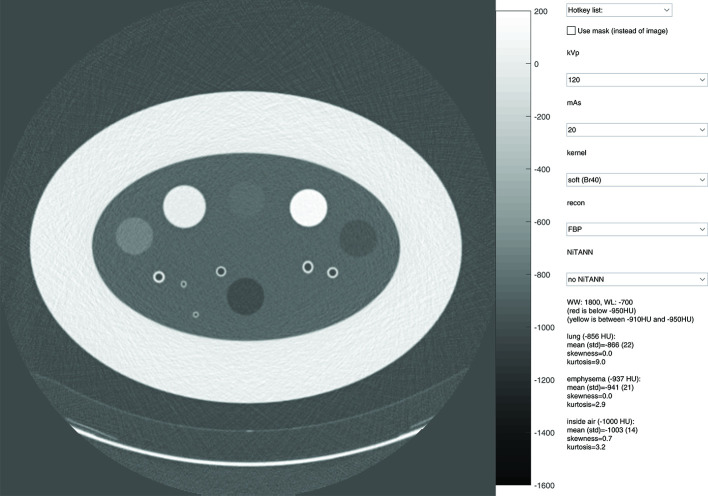
Figure 4.
Layout of the user interface used to assess the visual differences caused by changing acquisition parameters and post-filtering parameters. The top drop-down menu can be used to change several parameters at once. The check box can be used to switch between normal view and mask view. In the mask view, voxels with a density below −950 HU are marked red, and all voxels with a density between −910 and −950 HU are marked yellow. The window level setting is adjusted by dragging, and the setting is shown in the text area. HU, Hounsfield unit.

