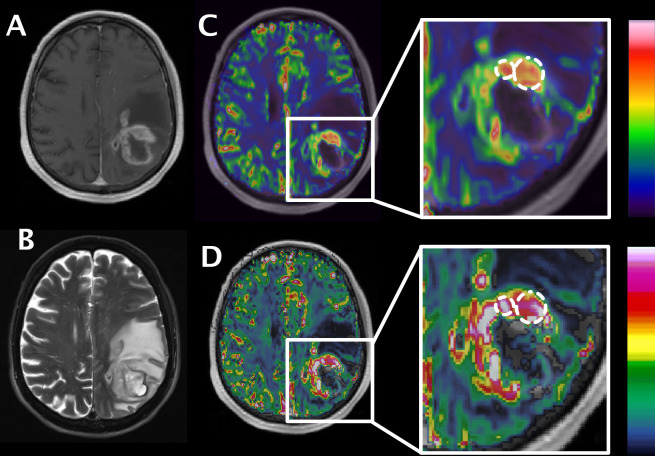
Figure 2. .
ROI positioning in a representative brain tumor case. Anatomical images T1W + Gd (A) and T2W fat-sat (B) of a left parietooccipital glioblastoma. rBVc map fused with T1W + Gd produced with Olea sphere (C) and with NordicICE (D). Larger ROI represents “whole tumor” with sparing of necrotic/cystic component; smaller ROI represents the tumor hotspot. We placed ROIs in Olea sphere and exported the ROI matrix coordinates. These coordinates were transformed into a format that can be imported into NordicICE with a dedicated, in-house developed software. ROI, region of interest.

