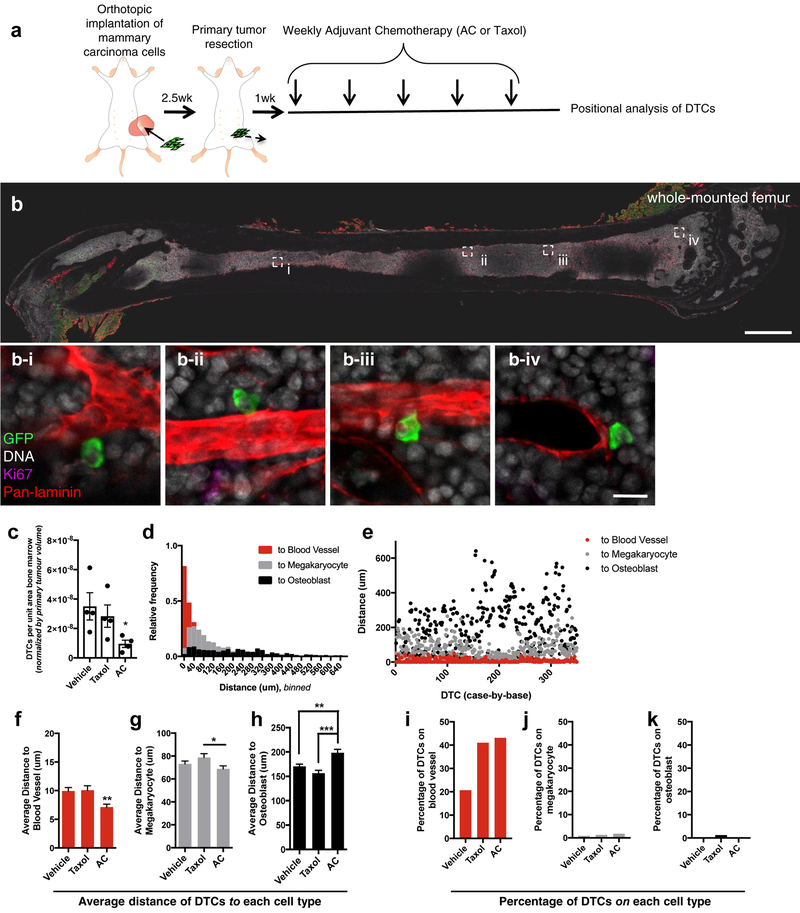
Figure 1: Dose-dense chemotherapeutic regimens select for perivascular disseminated tumour cells.
a) Schematic of the experiment to identify if DTCs localize to a specific nice following dose-dense chemotherapy. After resection of the ffluc-eGFP+ primary tumour, mice were treated with five cycles of weekly adriamycin (2mg/kg) and cyclophosphamide (AC; 60mg/kg), paclitaxel (Taxol; 20 mg/kg), or vehicle. DTC position within BM was analyzed by staining and whole-mounting femurs one week after final treatment. b) Tile scans encompassing the entire exposed face of the BM and the full Z-depth (~100 μm) that could be imaged using this method were acquired. Scale bar, 1 mm. b i-iv) Four examples of perivascular, GFP+, Ki67− DTCs are shown in BM following AC treatment (scale bar, 20 μm). c) Quantification of DTCs in femoral BM of vehicle-, Taxol- and AC-treated animals, normalized by BM area analyzed and volume of the primary tumour at resection. For each treatment, n=4 femurs from 4 different animals were analyzed. * P= 0.022 vs. vehicle-treated mice by Kruskal-Wallis and Dunn’s test to correct for multiple comparisons. 350 DTCs were analyzed across n=3 femurs from three different animals, and d) binned in histogram format or e) dot-plotted as individual distances to the nearest blood vessel (red), megakaryocyte (gray) or osteoblast (black). f-h) The average of these distances to the nearest f) blood vessel, g) megakaryocyte and h) osteoblast for mice that underwent treatment with vehicle (n=488 DTCs analyzed across 3 animals), AC (n=350) or Taxol (n=327). ** P= 0.0039 (vs. vehicle) or P=0.0061 (vs. Taxol) for (f); * P=0.047 for (g); **P=0.0017 for (h) and *** P<0.0001 for (h); all by one-way analysis of variance (ANOVA) followed by Tukey’s multiple comparisons test. i-k) The percentage of DTCs quantified across three mice in direct contact with i) blood vessels, j) megakaryocytes and k) osteoblasts for mice that underwent treatment with vehicle, Taxol or AC. For c, f-h, centre line represents the mean, and error bars the s.e.m. Statistical tests and P values are indicated. Source data are provided in Supplementary Table 1.

