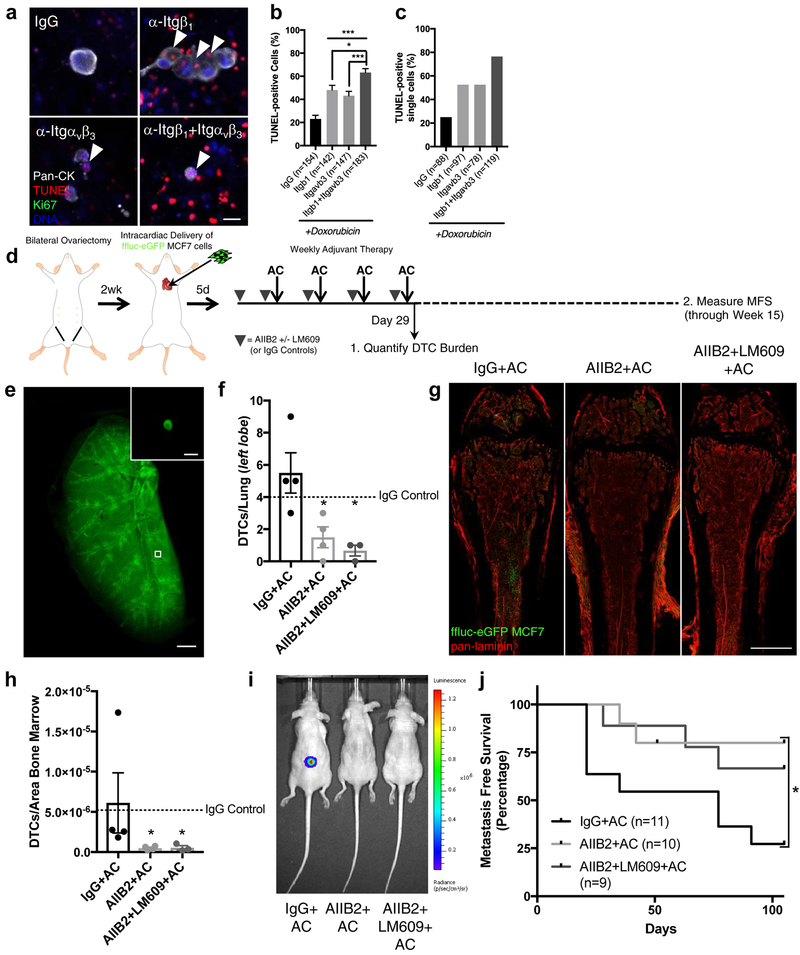
Figure 7: Targeting integrin-β1 sensitizes DTCs to chemotherapy and prevents bone metastasis.
a) Representative images of TUNEL-stained MCF-7 cells on BM MVNs following priming with integrin-β1 and/or -αvβ3 function-blocking antibodies, and 2500 nM doxorubicin. White arrowheads, apoptotic DTCs. Scale bar, 20 μm. Percentage of b) TUNEL-positive cells from predominantly single cells and clusters of 2–4 cells and c) TUNEL-positive single cells. The number of cells/clusters analyzed per condition across n=3 independent experiments is stated within each panel.***P≤ 0.0007 for IgG primed vs. single agent priming; *P= 0.0149 for integrin β1 primed vs. dual agent priming; ***P=0.0004 for integrin αvβ3 primed vs. dual agent priming, all by one-way ANOVA and Tukey’s post-test. d) Schematic of experiment to test the effect of blocking integrin β1 and integrin αvβ3 function on DTC survival and bone metastasis in vivo. e) Representative image of the left lobe of a Ce3D55 cleared lung, stained for eGFP to quantify lung DTCs. Scale bar, 1mm. Inset: representative DTC. Scale, 10 μm. f) DTCs/lung following treatment (Day 29). *P=0.022 for AIIB2+AC (n=4 lungs from four animals) vs. IgG+AC (n=4 lungs from four animals), P=0.013 for AIIB2+LM609+AC (n=3 lungs from three animals) vs. IgG+AC; by one-way ANOVA and Dunnett’s post-test. Dashed line: mean value for mice treated with IgG only. g) Representative images of whole-mounted left femoral heads from animals treated with IgG+AC, AIIB2+AC and AIIB2+LM609+AC. Scale bar, 1 mm. h) DTCs/area BM following treatment (Day 29). *P=0.050 for AIIB2+AC (n=4 femurs from four animals) vs. IgG+AC (n=4 femurs from four animals); P=0.043 for AIIB2+LM609+AC (n=3 femurs from three animals) vs. IgG+AC, by Kruskall-Wallis test and Dunn’s post-test. Dashed line: mean value for mice treated with IgG only. i) Bioluminescence of mice from each treatment group at week 15. j) Kaplan-Meier analysis of metastasis-free survival. *P=0.039 by Log-rank Mantel-Cox test; P=0.034 by Gehan-Breslow-Wilcoxon method. Tick mark represents one censored mouse that died of unknown causes. Cohort size: IgG+AC: 11 animals; AIIB2+AC: 10 animals; AIIB2+LM709+AC: 9 animals. For b, f, h centre line represents the mean, error bars: s.e.m. Source data for b, f, h, j provided in Supplementary Table 1.

