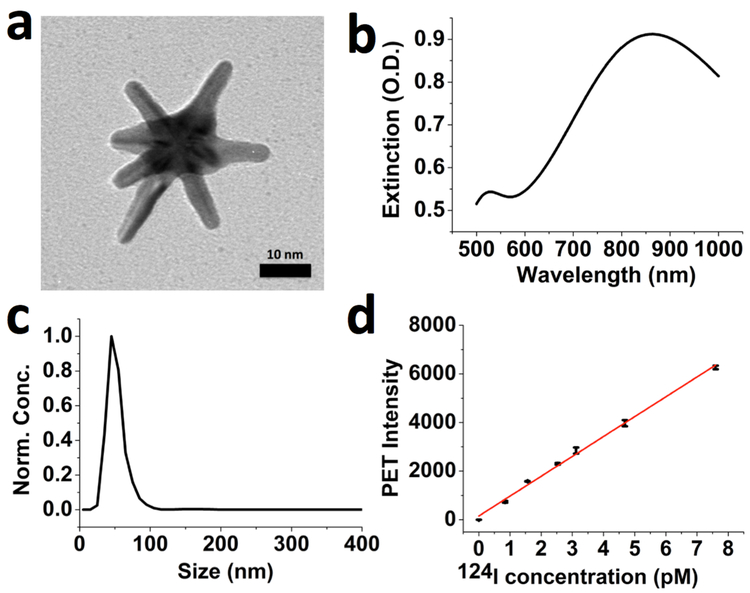
Figure 1.
Characterization of gold star nanoparticles. (a) Transmission electron microscopy (TEM) image of synthesized GNS nanoparticle with a 10-nm scale bar. (b) VIS-NIR extinction spectrum of 0.2 nM PEGylated GNS aqueous solution. (c) Hydrodynamic size distribution of PEGylated GNS nanoprobes measured by nanoparticle tracking analysis (NTA) method. (d) PET sensitivity evaluation for 124I-GNS. Data points with error bar in black color were experiment results and the red line was linearly fitted from experimental data points. The standard error of the regression was calculated to be 135.68. The fitted equation is y = 817.64x + 151.35 with the adjusted R2 = 0.997. Error bar shows the standard deviation (n=3).

