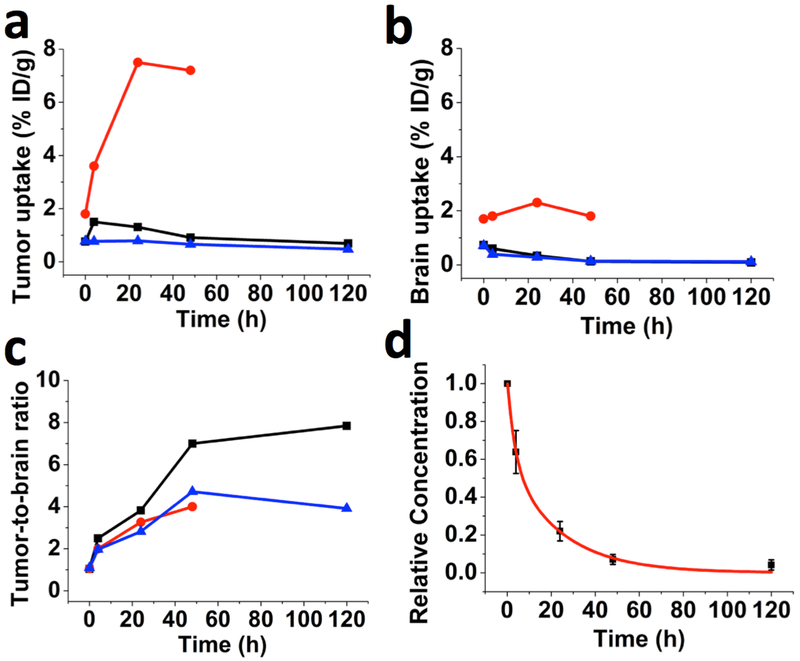
Figure 2.
GNS uptake in tumor and normal brain tissues measured by PET/CT. The maximum PET signal was measured for brain tumor and its contralateral normal brain tissue. (a) 124I-GNS brain tumor uptake, (b) 124I-GNS normal brain uptake, and (c) tumor-to-normal brain PET signal ratios measured at different time points for 3 mice (Mouse 1, black; Mouse 2, red; Mouse 3, blue) with orthotopic brain tumors. Quantitative results are shown in the Table S2. (d) Nanoprobe relative concentration in blood was measured from dynamic PET/CT scans in the heart at 10 min, 4 h, 24 h, 48 h and 120 h after IV injection and normalized to the concentration value at 10 min. The nanoprobe relative concentrations (black color) are fit to a two-compartment pharmacokinetic model (Adjusted R2 = 0.991) and the fitted curve is in red color. The error bars indicate standard deviations (n=3). Please note that mouse 2 (red) was sacrificed at 48 h time point due to brain tumor symptoms. The high 124I-GNS uptake for mouse 2 (red) might be due to large tumor size (Figure. S3), which results in increased vasculature leakage.

