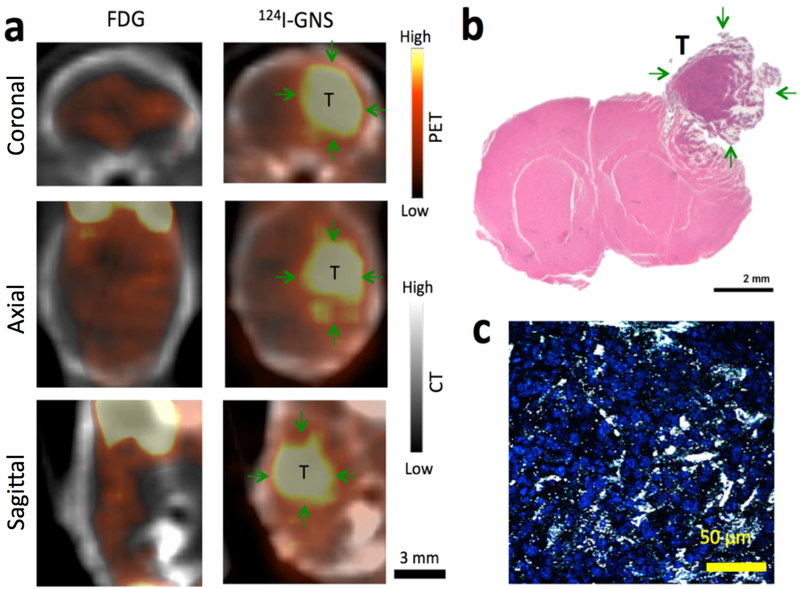
Figure 4.
Brain tumor detection comparison with 18F-FDG and 124I-GNS using PET/CT scan. (a) Comparison of 18F-FDG and 124I-GNS for brain tumor detection by PET imaging in the same brain tumor-bearing mouse (Mouse 2). The PET/CT scan with 18F-FDG was performed 1 h after injection. The PET/CT scan with 124I-GNS was performed 48 h after injection. The average tumor uptake of the 124I-GNS nanoprobe was 7.2 %ID/g and the T/N ratio was 4.0 while the T/N ratio for 18F-FDG was 1.1. (b) H&E histopathology examination of the brain tumor detected by PET scan; green arrows indicate tumor (T). Tumor was peeled off from brain during tissue harvest process and image was reconstructed to combine tumor with brain. (c) TPL imaging shows GNS (white spots) being inside brain tumor detected from PET scan. The brain tumor section was stained with DAPI (blue) to show cell nuclei. The image represents a 5 μm tissue section.

