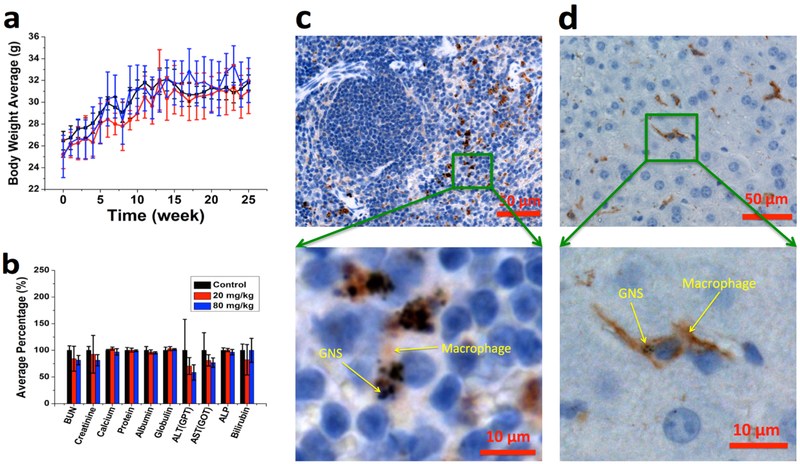
Figure 7.
Toxicity study of mice after GNS IV administration. (a) Average bodyweight of animals in each cohort of 6-month toxicity study was monitored weekly; no significant difference was found between control (black) and GNS IV injection groups (20 mg/kg (red) or 80 mg/kg dose (blue)). (b) Blood chemistry test results for mice 6 months after IV injection of PBS (black), GNS with a dose of 20 mg/kg (red) and 80 mg/kg (blue). Error bar represents standard deviation (n = 4). F4/80 immunohistochemistry (IHC) staining (brown) was performed for spleen (c) and liver (d) to show macrophages (Kupffer cells). The GNS (black spots) nanoparticles were found overlaid with macrophage cells (brown).

