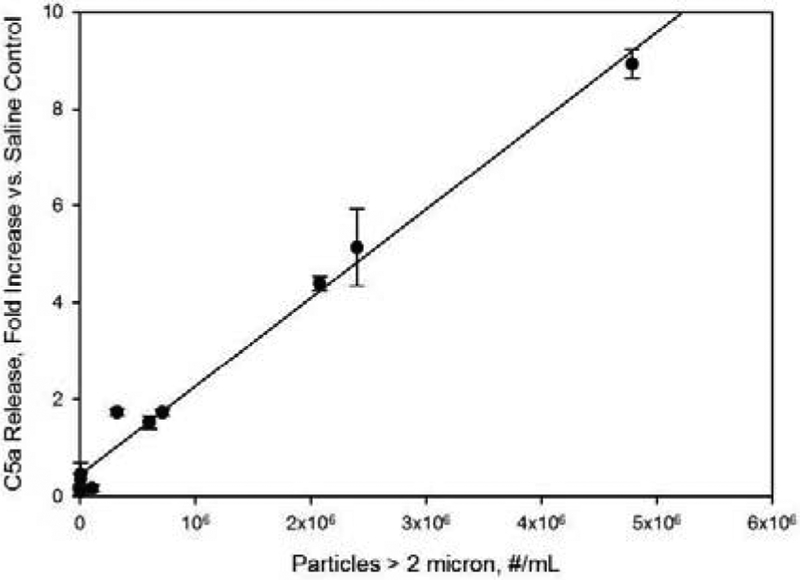
Figure 5.

Effect of sample particle levels on C5a concentration in human serum samples. Concentrations are reported as fold increases vs. C5a levels for saline control samples. Particle concentrations refer to concentrations in IVIg formulations prior to 10-fold dilution into human serum. Line represents a least-squares linear fit, with correlation coefficient r2= 0.99.
