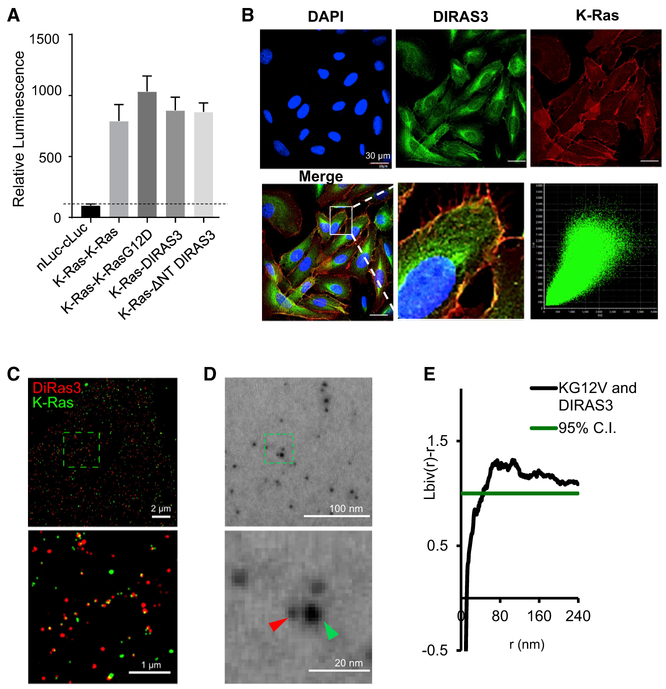
Figure 4. DIRAS3 Co-localizes with RAS at the Plasma Membrane (PM).
(A) Luminescent signals were determined for several ReBiL cell lines to detect low- affinity protein-protein interactions that were normalized to that of p53-MDM2. nLuc-cLuc was used as a negative control. K-RAS and K-RASG12D interaction was nearly 400% of p53-MDM2, and K-RAS-DIRAS3 or K-RAS-NTD was slightly less. K-RAS and DIRAS3 C226S did not show a robust luminescence signal. Data were obtained from three independent experiments performed in triplicate. Columns indicate the mean, and the bars indicate the SD (**p < 0.01).
(B) DIRAS3 co-localizes with K-RAS. U2OS-701 cells were treated with DOX for 24 h. Immunofluorescence staining of expressed DIRAS3 and K-RAS was analyzed by confocal microscopy. Scale bars represent 30 μM.
(C) U2OS TR2 cells were treated with doxycycline for 24 h to induce K-RAS expression and simultaneously transfected with DIRAS3 pcDNA plasmid. STORM imaging at TIRF confirmed the interaction between DIRAS3 and K-RAS on the membrane. Scale bars represent 2 μm and 1 μm for the higher magnification. DIRAS3 is labeled in red and K-RAS is labeled in green.
(D) TEM of DIRAS3- and K-RAS-labeled gold nanoparticles on the inner leaflet of the PM of Hey-A8-DIRAS3 ovarian cancer cells following induction of DIRAS3 by doxycycline for 24 h. GFP-tagged K-RASG12V, which was expressed by lentiviral infection, was immunolabeled with 6-nm gold nanoparticles linked to anti-GFP antibody, and endogenous DIRAS3 was immunolabeled with 2-nm gold particles linked to anti-DIRAS3 (ID8). Gold particles were then imaged by TEM at 100,000× magnification. Scale bars represent 100 nm and 20 nm for the higher magnification. DIRAS3 is labeled in red (2nm gold) and K-RAS is labeled in green (6 nm gold).
(E) Bivariate K-function analysis of TEM documenting the extent of clustering and size of the clusters observed between K-RAS and DIRAS3 on the surface of the PM. Spatial co-clustering between 6-nm and 2-nm gold particles was assessed using the bivariate K-function where values above 1 indicate statistically significant co-localization between DIRAS3 and K-RAS on the PM. At least 15 PM sheets were imaged, analyzed, and pooled for each condition.

