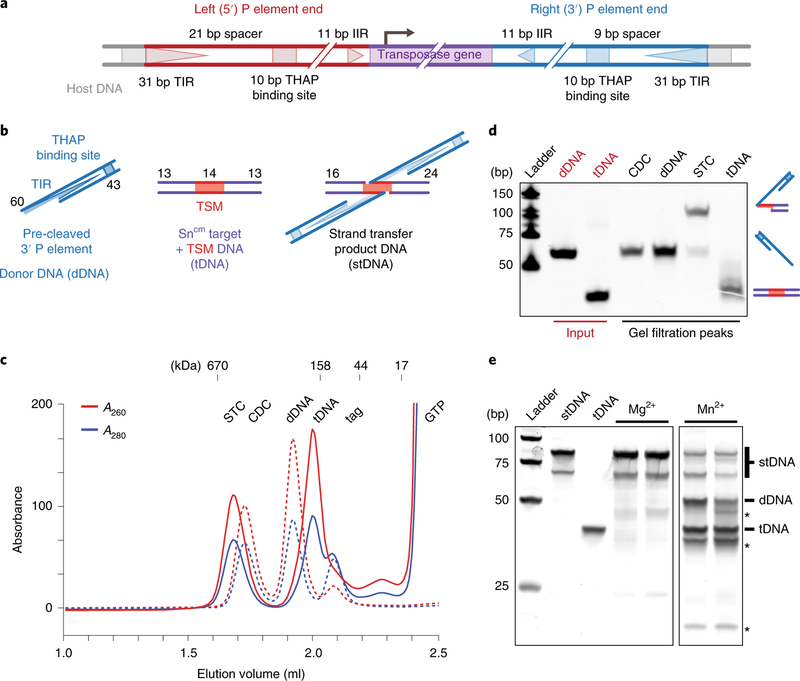
Fig. 1 |. Reconstituted strand transfer complex represents the active form of TNP.
a, Diagram of the full-length P element transposon depicting the differently spaced 5′ and 3′ ends. The 31 bp TIRs (triangles), 10 bp THAP domain binding site (squares), the 11 bp IIRs (triangles) and the TNP gene (purple) are indicated. The 5′ and 3′ P element ends are colored red and blue, respectively. Not drawn to scale. b, Schematic of the DNA substrates used. The nucleotide length of each strand is indicated (TSM, target sequence motif; dDNA, donor DNA; tDNA, target DNA; stDNA, strand transfer product DNA). Not drawn to scale. c, Cleaved donor complex (CDC) and strand transfer complex (STC) gel filtration elution profiles (CDC, dotted lines; STC, solid lines). Absorbance A260 and A280 is indicated in red and blue, respectively. Elution positions of mass standards (in kDa) are shown above. d, SYBR Gold stained urea PAGE of dDNA input, tDNA input and peak fractions from c. Schematics of DNAs are shown to the right. Input DNA standards are colored red. bp, base pairs of markers. e, SYBR Gold stained native PAGE gel of disintegration assay with strand transfer product DNA. The expected mobilities of the dDNA and tDNA products are indicated to the right. Unidentified bands are indicated with asterisks. The uncropped gel image is provided in Supplementary Data Set 1.

