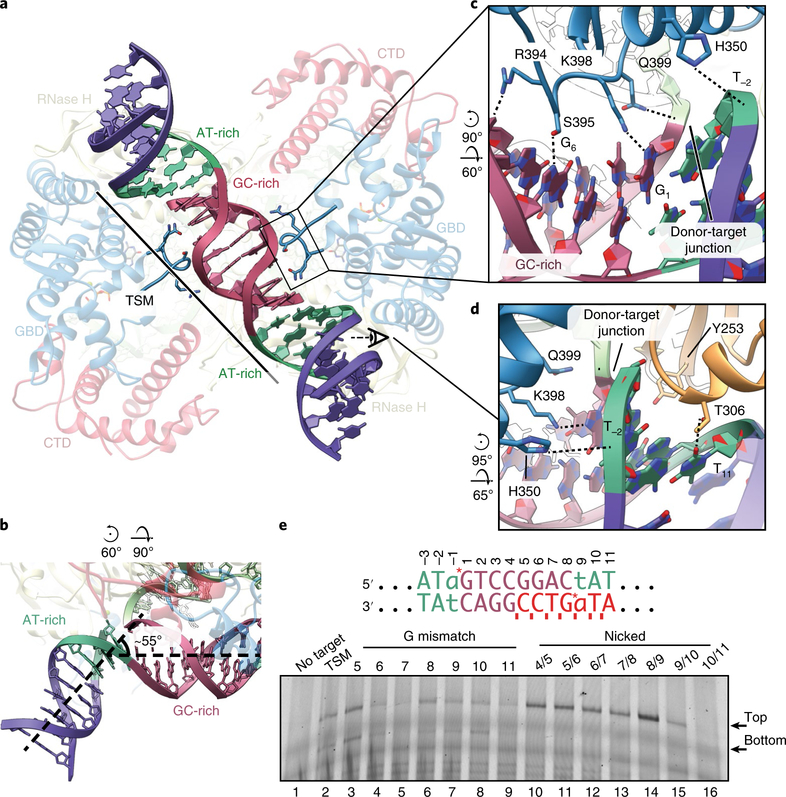
Fig. 5 |. The tDNA is severely bent at AT-rich sites.
a, Bottom view of the STC, highlighting the bent tDNA. AT-rich (green) and GC-rich (red) regions of the tDNA are indicated. The GBD loop that interacts with the tDNA is shown. The transposase protein is faded out for clarity with relevant domains labeled. All subsequent panel rotations are depicted with respect to a. b, Bend at flanking AT-rich sites. The bend is highlighted and dashed lines indicate the central axis of the DNA. The tDNA is colored as in a. c, Close-up view of the tDNA-GBD-loop interaction inferred from the atomic model. Site-specific interactions are indicated (S395:G6, K398:G1). Nucleotides are numbered as in e. d, Close-up view of tDNA-RNase H domain interaction inferred from the atomic model. Site-specific interactions are indicated (T306:T11). A region of tDNA backbone has been made transparent for clarity. e, Denaturing PAGE gel of a transposition assay using mismatched or nicked tDNA substrates. The sequence of the TSM is shown above. Sites of transposition into the top and bottom strand are indicated with red asterisks (top strand, −1, 1; bottom strand, 8, 9). Nucleotide numbering corresponds to the top strand. G mismatches were introduced within the bottom strand at the indicated positions (red bases). Nicks were introduced into the bottom strand between the indicated positions (red ticks). Expected sizes of transposition into the top strand or bottom strand of the tDNA are indicated to the right of the gel. The transferred strand of the dDNA was fluorescently labeled at the 5′ position with a TAMRA dye. The uncropped gel image is shown in Supplementary Data Set 1.

