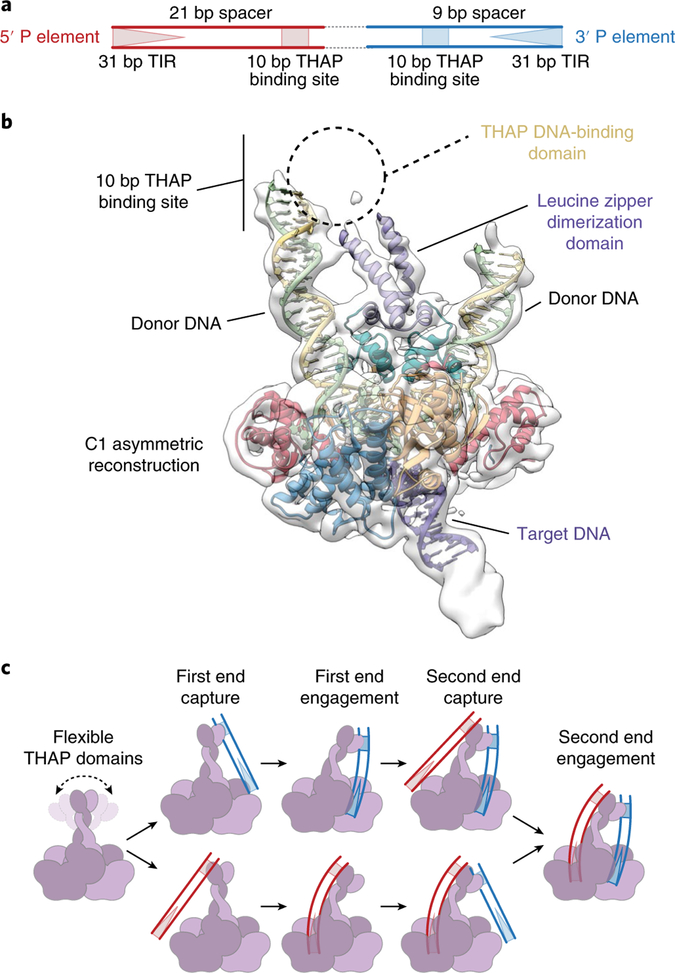
Fig. 6 |. The unsymmetrized reconstruction suggests a mechanism for 5′ and 3′ P element end pairing.
a, Diagram of a P element transposon depicting the differently spaced 5′ and 3′ ends. The 31 bp TIRs (triangles) and 10 bp THAP domain binding site (squares) are indicated. The 5′ and 3′ P element ends are colored red and blue, respectively. b, Unsymmetrized 3.9 Å reconstruction showing additional density near the N terminus. Additional dDNA and the leucine zipper dimerization domain were modeled into the density. The expected position of the THAP domain and the THAP domain binding site are indicated. c, Model for pairing of the5′ and 3′ P element ends. The TNP protein (purple and light purple), 3′ P element transposon end (blue) and the 5′ P element transposon end (red) are represented as cartoons.

