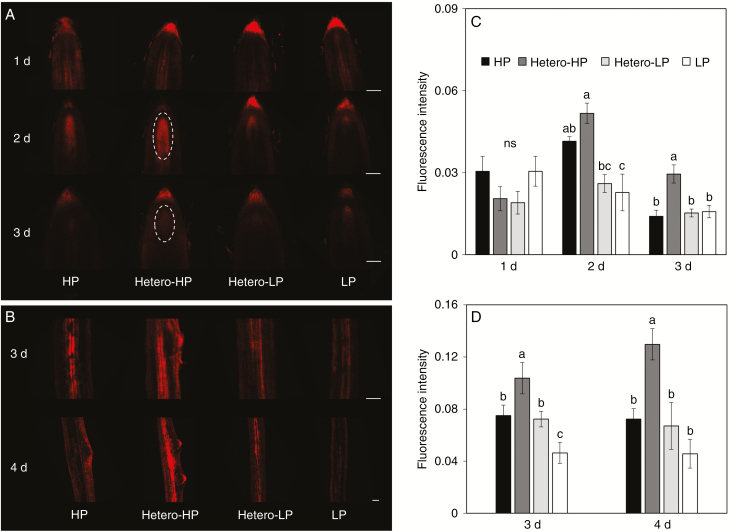
Fig. 7.
Effect of homogeneous and heterogeneous Pi supply on tissue-specific auxin distribution at 1, 2, 3 and 4 DAT. Auxin response reporter activity in DR5::RFP-expressing transgenic maize lines was observed in longitudinal orientation close to (A) the first-order LR tip meristematic zone and (B) the second-order LR initiation zone. Scale bars = 100 µm. The fluorescence signal intensity was measured (C) in the first-order LR apical meristematic zone at 1, 2 and 3 DAT, and (D) in the second-order LR initiation zone at 3 and 4 DAT. For explanation of treatments see the legend of Fig. 2. Each value represents the average fluorescence intensity of 10–15 pictures. Bars indicate means ± s.e. for four biological replicates and each replicate comprised six to ten individual root segments. Different letters indicate significant differences among treatments on each given day (P < 0.05).

