
Figure 2.
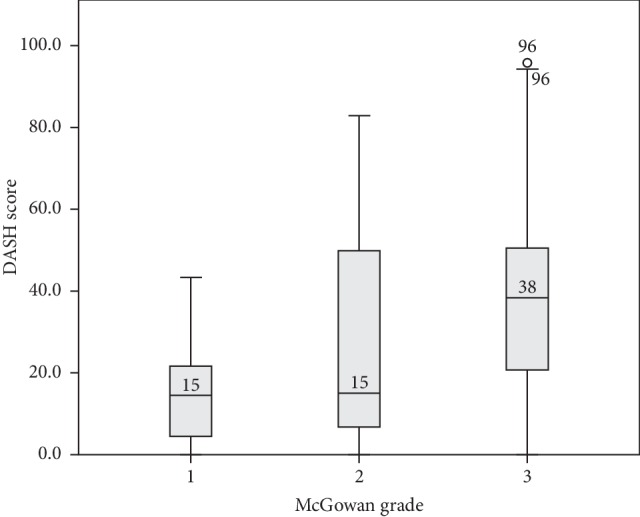
Postoperative scores from the Disabilities of the Arm, Shoulder and Hand (DASH) questionnaire and the distribution for each preoperative McGowan grade. The median value for each McGowan grade is a marked line on the box plot. Grade 3 statistically differed from grades 1 and 2 (Kruskal–Wallis test, p=0.002; subsequent Mann–Whitney U test; values written in McGowan grade 3 are outliers).