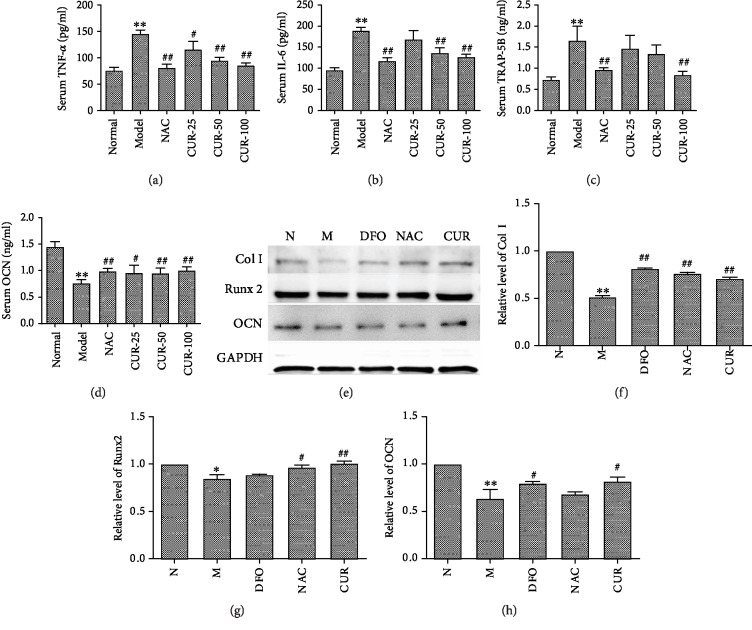
Figure 2.
The regulatory effect of CUR on bone metabolism in iron-overload mice and MC3T3-E1 cells treated with excess iron. (a–d) Serum level of TNF-α, IL-6, TRACP-5b, and OCN in iron-overload mice assayed with an ELISA kit. (e–h) The expression of Col1, Runx2, and OCN in MC3T3-E1 cells treated with excess iron. Results are represented as the mean ± SD. (n = 10 in animal experiments; n = 6 in osteoblast experiments), ∗P < 0.05 and ∗∗P < 0.01, compared with the normal control group; #P < 0.05 and ##P < 0.01, compared with the model group. N: normal control group, cells were treated with DMSO; M: model group, cells were treated with FAC (500 μM); DFO: cells were treated with DFO (100 μM) and FAC (500 μM); NAC: cells were treated with NAC (1000 μM) and FAC (500 μM); CUR: cells were treated with CUR (10 μM) and FAC (500 μM).

