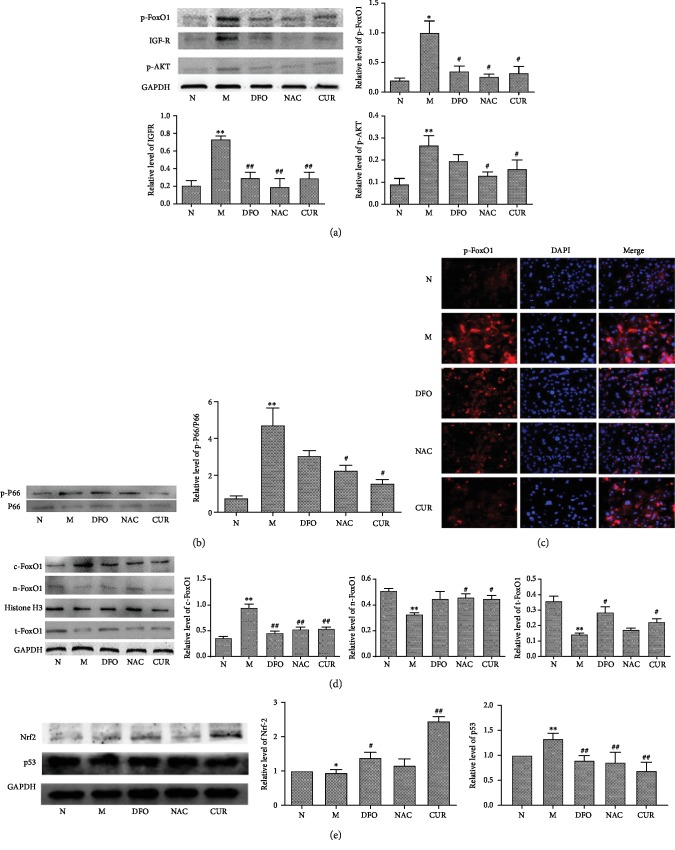
Figure 4.
CUR regulates the protein expression in the FoxO1 pathway of osteoblastic MC3T3-E1 cells treated with excess iron. Osteoblastic MC3T3-E1 cells were treated with CUR, NAC, or FAC for 48 h, and after 2 h treatment, cotreated with FAC. Western blot analysis and immunofluorescence staining were used to detect the expression of related proteins in the FoxO1 pathway. (a) Protein levels of p-FoxO1, IGFR, and p-Akt. (b) Protein level of p-p66. (c) Immunofluorescence staining of p-FoxO1. (d) Distribution analysis of FoxO1 in the cytoplasm and nucleus. (e) Protein levels of Nrf2 and p53. Results are represented as the mean ± SD (n = 3). ∗P < 0.05, ∗∗P < 0.01 compared with the normal control group; #P < 0.05, ##P < 0.01 compared with the model group. N: normal control group, cells were treated with DMSO; M: model group, cells were treated with FAC (500 μM); DFO: cells were treated with DFO (100 μM) and FAC (500 μM); NAC: cells were treated with NAC (1000 μM) and FAC (500 μM); CUR: cells were treated with CUR (10 μM) and FAC (500 μM).

