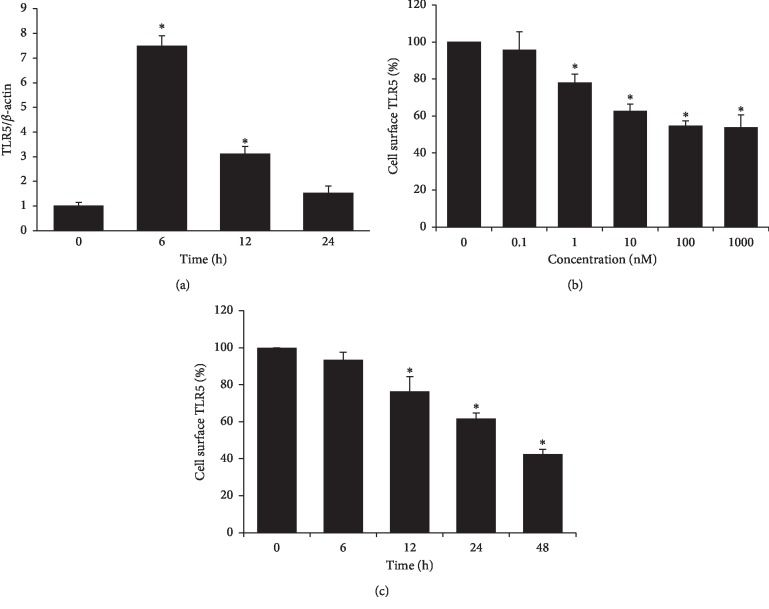
Figure 5.
ATRA upregulates TLR5 mRNA but decreases cell surface TLR5 expression of THP-1 cells in a time- and concentration-dependent manner. THP-1 cells were treated with 1 μM ATRA for different time periods as indicated above (a, c) or with various concentrations of ATRA as indicated above for 24 h (b). The mRNA level was assessed by qRT-PCR (a) and cell surface expression of TLR5 was measured by flow cytometry (b, c). Bar graphs indicate relative TLR5 expression ± SD. ∗p < 0.05 vs. DMSO control.

