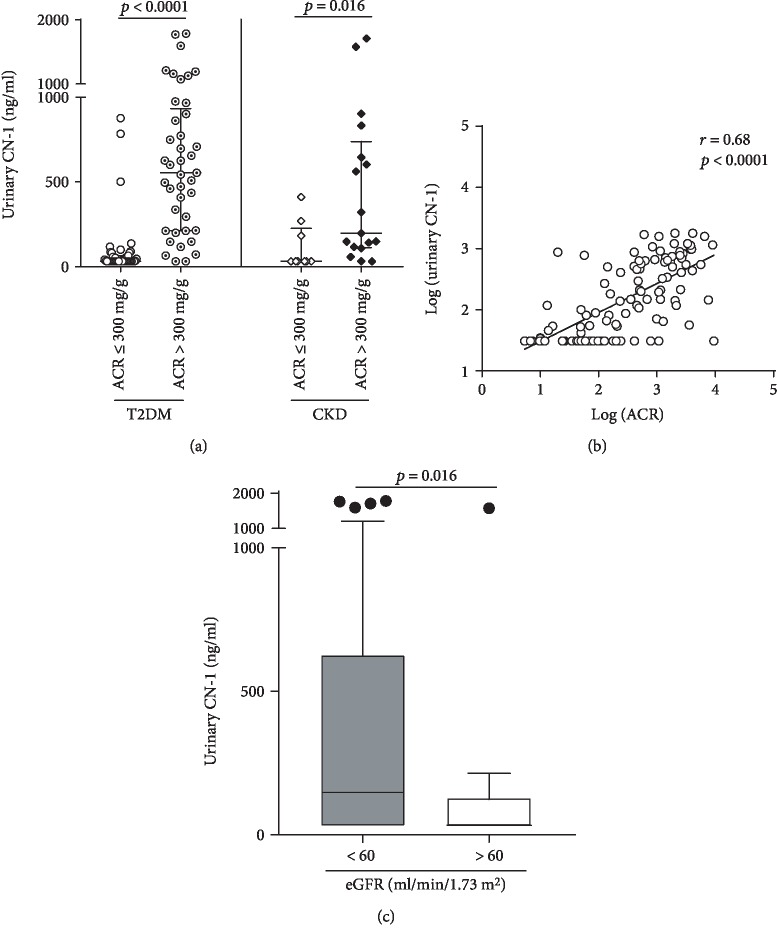
Figure 1.
(a) Distribution of CN-1 in spot urine of T2DM and nondiabetic patients (CKD) with normo- or microalbuminuria (ACR ≤ 300 mg/g) and macroalbuminuria (ACR > 300 mg/g). Results for each individual patient are shown as well as the median and IQR (lines) for each of the different groups. (b) Pearson correlation between ACR [log (ACR)] and urinary CN-1 concentrations [log (urinary CN-1)] in patients with T2DM and nondiabetic CKD patients (n = 111). (c) Distribution of urinary CN-1 concentrations in all patients according to eGFR. T2DM and CKD patients (n = 111) were stratified according to reduced (eGFR < 60 ml/min/1.73m2) (n = 95) and preserved renal function (eGFR > 60 ml/min/1.73m2) (n = 16). eGFR was estimated using the CKD-EPI formula. Boxes and whiskers represent the median and IQR. Outliers are indicated by circles.

