Figure 4.

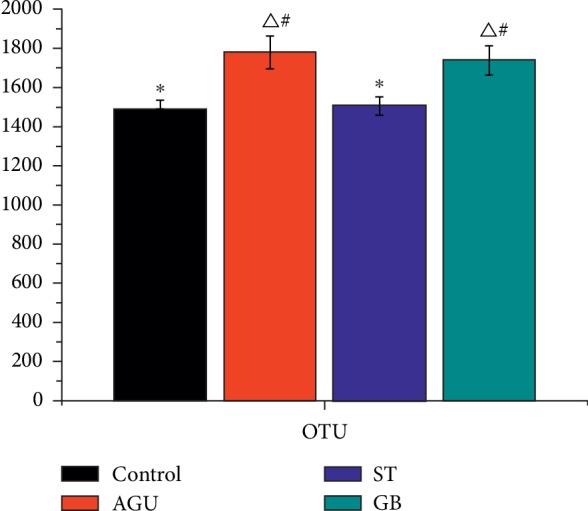
OUT abundance of feces in each group (Δsignificant difference from the control group at P < 0.05, ∗significant difference from the AGU group at P < 0.05, #means difference from the ST group at P > 0.05).

OUT abundance of feces in each group (Δsignificant difference from the control group at P < 0.05, ∗significant difference from the AGU group at P < 0.05, #means difference from the ST group at P > 0.05).