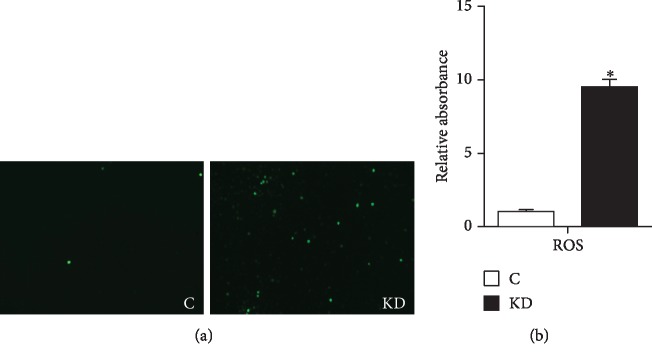
Figure 2.
(a) ROS generation was performed by immunofluorescence using DCFH-DA (green fluorescence, 5 mM) in cells. C indicates the control group; KD indicates the knockdown group. Cardiomyocytes were visualized using fluorescence microscopy. (b) The effects of IGF1 knockdown on the ROS levels in cardiomyocytes were detected by using a fluorescence microplate reader. C indicates the control group; KD indicates the knockdown group. ∗ shows a significant difference from the corresponding control (P < 0.05). n = 3.

