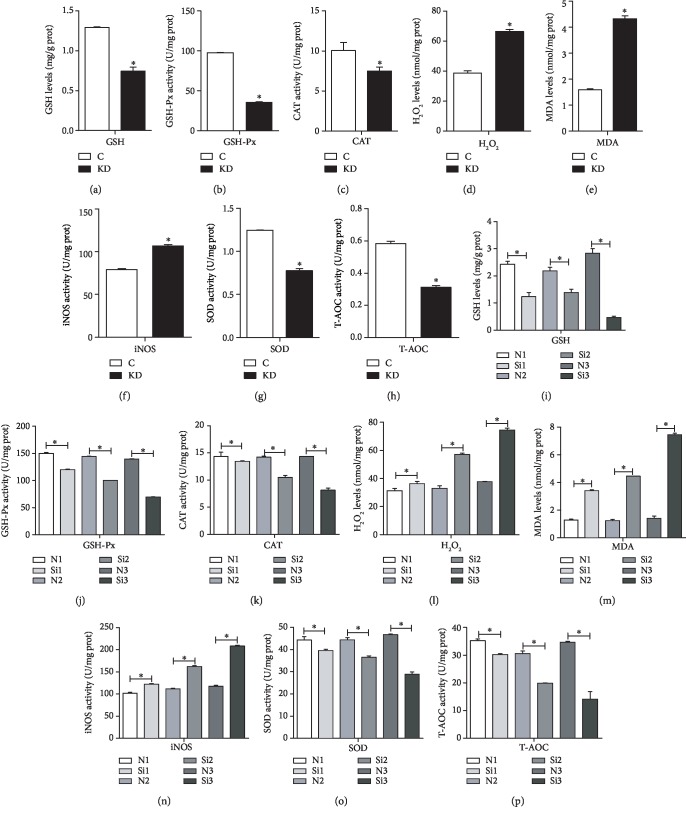
Figure 3.
(a–h) Oxidative stress markers of the GSH, GSH-Px, CAT, H2O2, MDA, iNOS, SOD, and T-AOC contents were measured in cardiomyocytes. (i–p) Oxidative stress markers of GSH, GSH-Px, CAT, H2O2, MDA, iNOS, SOD, and T-AOC contents were measured in the myocardium. C indicates the control group; KD indicates the knockdown group in vitro; N indicates the normal group; Si indicates the knockdown group in vivo. ∗ shows a significant difference from the corresponding control (P < 0.05). n = 3.

