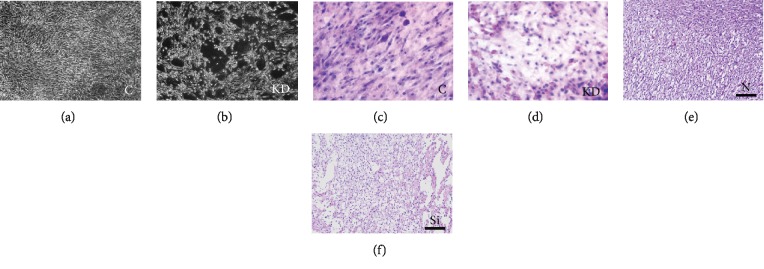
Figure 8.
Morphological observation was performed in cardiomyocytes transfected with Opti-MEM (C group, a) and siRNA (KD group, b) for 24 h. Cardiomyocytes were stained by H.E., and the results are shown in (c) and (d). H.E. staining for myocardial tissues in the N group (e) and the Si group (f). C indicates the control group; KD indicates the knockdown group in vitro; N indicates the normal group; Si indicates the knockdown group in vivo.

