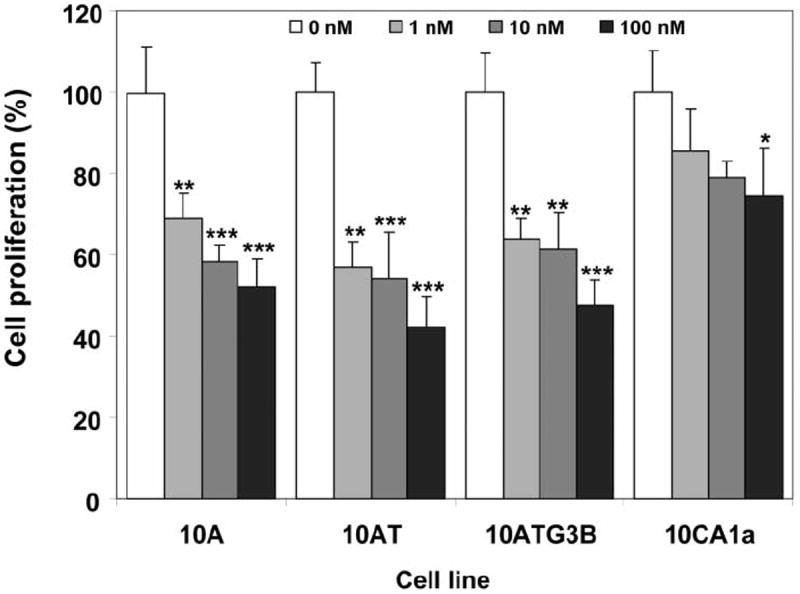
Figure 1.

Inhibition of cell growth by rapamycin. Cells were treated with rapamycin for 48 h and cell viability was determined as described in Materials and Methods. Columns and error bars represent the mean±SE of three separate experiments at each concentration. (*) indicates significant difference from control at p<0.05; (**) indicates significant difference from control at p<0.01; (***) indicates significant difference from control at p<0.001.
