
Figure 2.
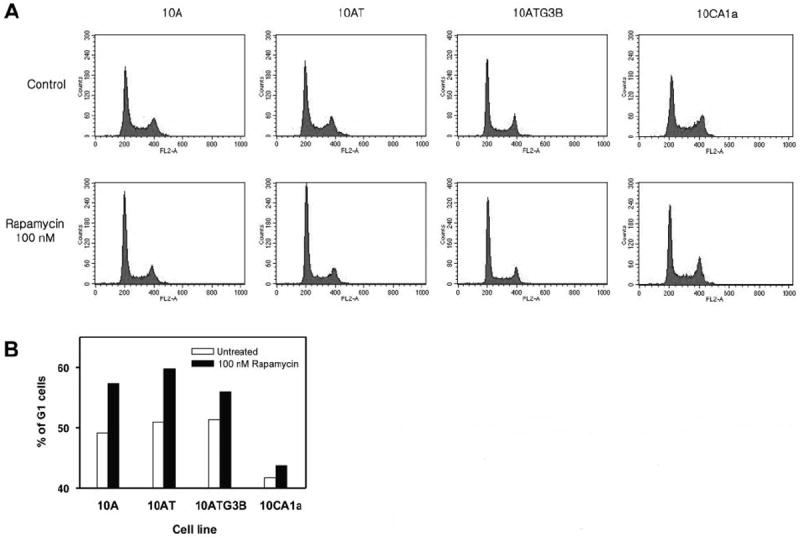
Differential effects of rapamycin on cell cycle progression in MCF10A cell lineage. Cells were incubated with or without 100 nM rapamycin for 48 h and prepared as described in Materials and Methods. Panel A: Histogram showing relative DNA content as determined by flow cytometry. Panel B: The increased percentage of cells in the G1-phase of the cell cycle was determined from the histogram.