
Figure 4.
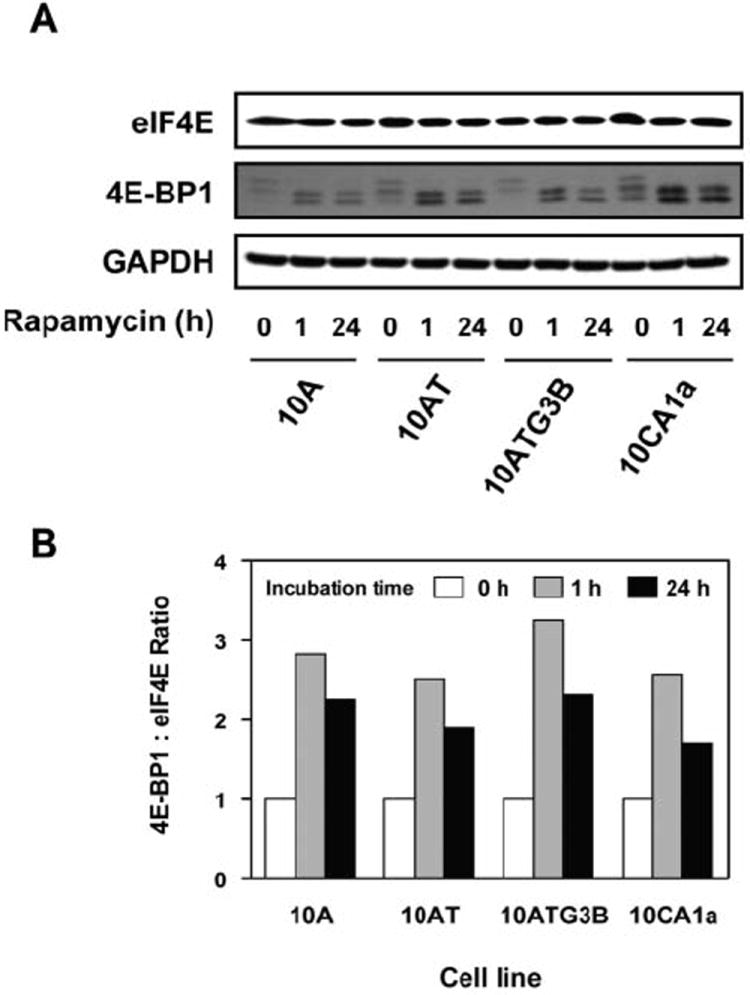
Rapamycin effects on eIF4E and 4E-BP1 in the MCF10A cell lineage. Panel A: Immunoblot analysis of 4E-BP1 and eIF4E protein levels following the treatment of each cell with 100 nM of rapamycin for 1 and 24 h. Panel B: 4E-BP1:eIF4E ratios were determined using band density of each cell line after treatment with 100 nM rapamycin for 1 and 24 h.