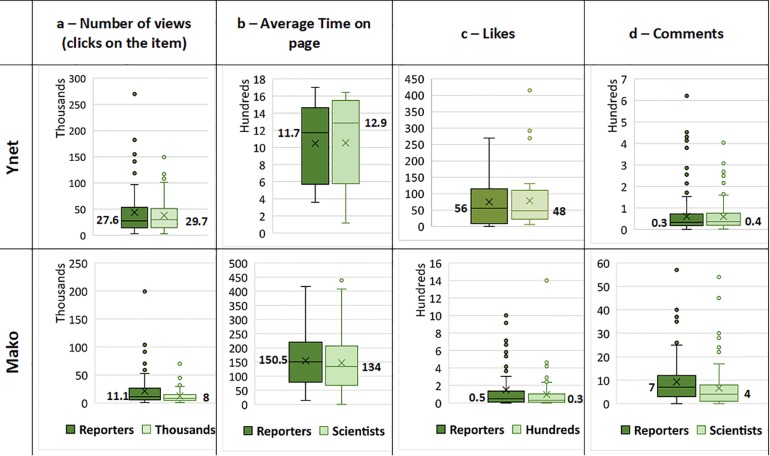
Fig 2. Number of views, average time on page, likes and comments for items authored by reporters and items written by trained scientists.
Top row portrays data from the Ynet news site, lower row shows data from the Mako news site. Column a. distribution of number of Clicks on items (Ynet n = 59 pairs, Mako n = 89 pairs); column b. distribution of average time spent on page (in sec.) (Ynet n = 53 pairs, Mako n = 92 pairs); c. distribution of the number of likes received (Ynet n = 32 pairs, Mako n = 85 pairs); column d. distribution of the number of comments on items written by reporters vs. trained scientists (Ynet n = 150 pairs, Mako n = 89 pairs). Median values are shown for each dataset.

