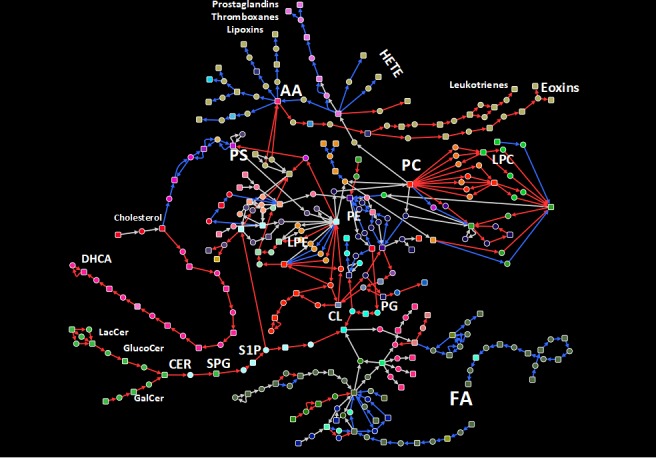
Fig 4. Extracted correlated lipid metabolism path network for RRMM and NDMM patients.

A sub-network comprised of top 50 correlated paths based on gene expression in RRMM and NDMM was extracted from the lipid metabolism path network. Red and blue edges indicate exclusive correlation in RRMM and NDMM patients, respectively. Grey edges indicate correlation in both conditions.
