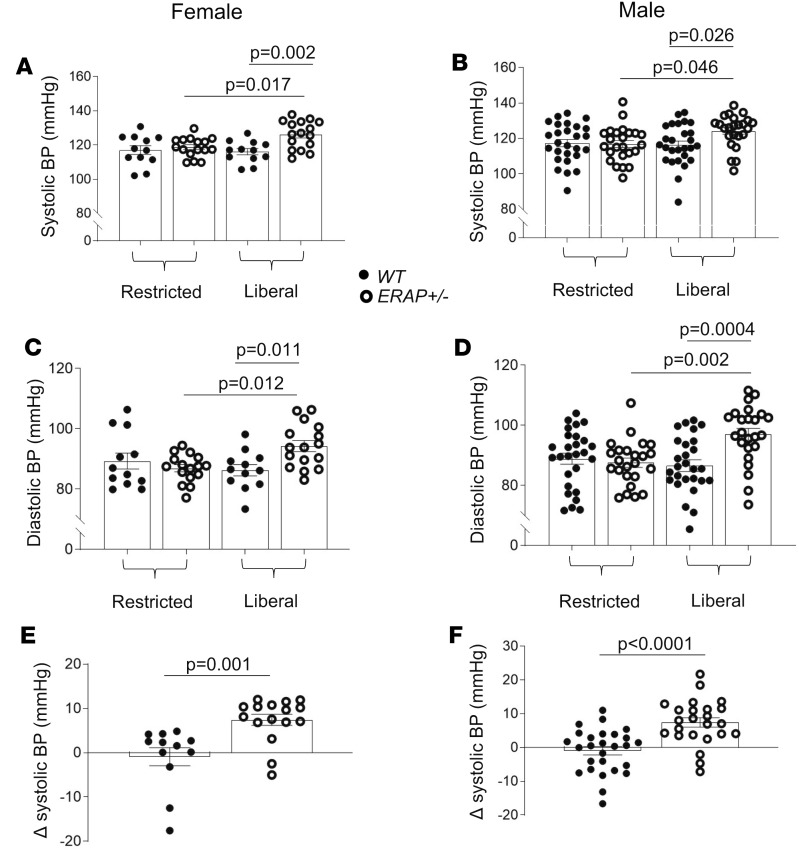
Figure 2. Effect of 1 week of restricted-salt diet and 1 week of liberal-salt diet on systolic and diastolic BP in female and male ERAP1+/– and WT mice.
Systolic (A and B) and diastolic (C and D) BP by tail-cuff measurements after 1 week on a restricted-salt diet and liberal-salt diet (Liberal). Measurements of SSBP (E and F) (Δ systolic BP = systolic BP on liberal minus systolic BP on restricted-salt diet). Filled circles indicate WT mice; open circles, ERAP1+/– mice. Data are presented as mean ± SEM. WT n = 12–27, ERAP1+/– n = 16–24; 1-way ANOVA for multiple groups (A–D) and 2-way Student’s t test for paired comparisons (E and F).

