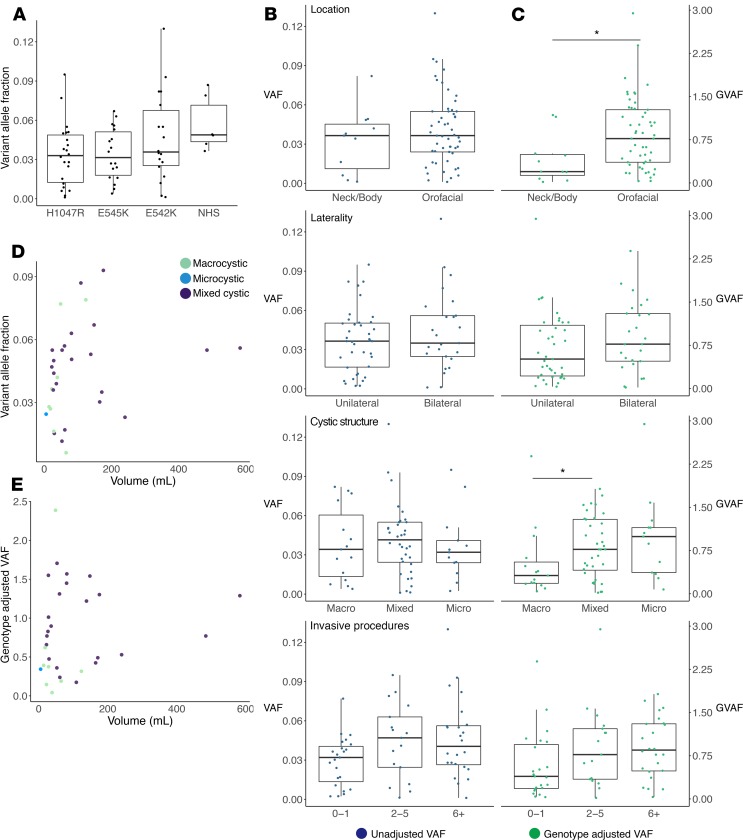
Figure 5. Variant allele fraction (VAF) and genotype-adjusted VAF (GVAF) comparisons by phenotype.
(A) Dot-box plot of VAF by mutation. Wilcoxon’s rank-sum test of hotspots versus NHS showed a trend toward increased VAF with NHS (P = 0.062). (B and C) Dot-box plots with (B) VAF (blue) on the left and (C) GVAF (green) on the right plotted by the 4 phenotype outputs: primary location, laterality, cystic structure, and number of procedures. Boxes are defined by the first quartile inferiorly, median, and third quartile superiorly, with whiskers extending to the farthest non-outlier point (defined as within 1.5 times the interquartile range) (A–C). Statistically significant results were seen for GVAF when analyzed by location and macro- versus microcystic structure. *P < 0.05 via Wilcoxon’s rank-sum test. (D and E) Dot plots with dots colored by cystic structure for volume by VAF (D) and GVAF (E) showed no correlation by Pearson’s correlation (n = 31). NHS, non-hotspot mutations.

