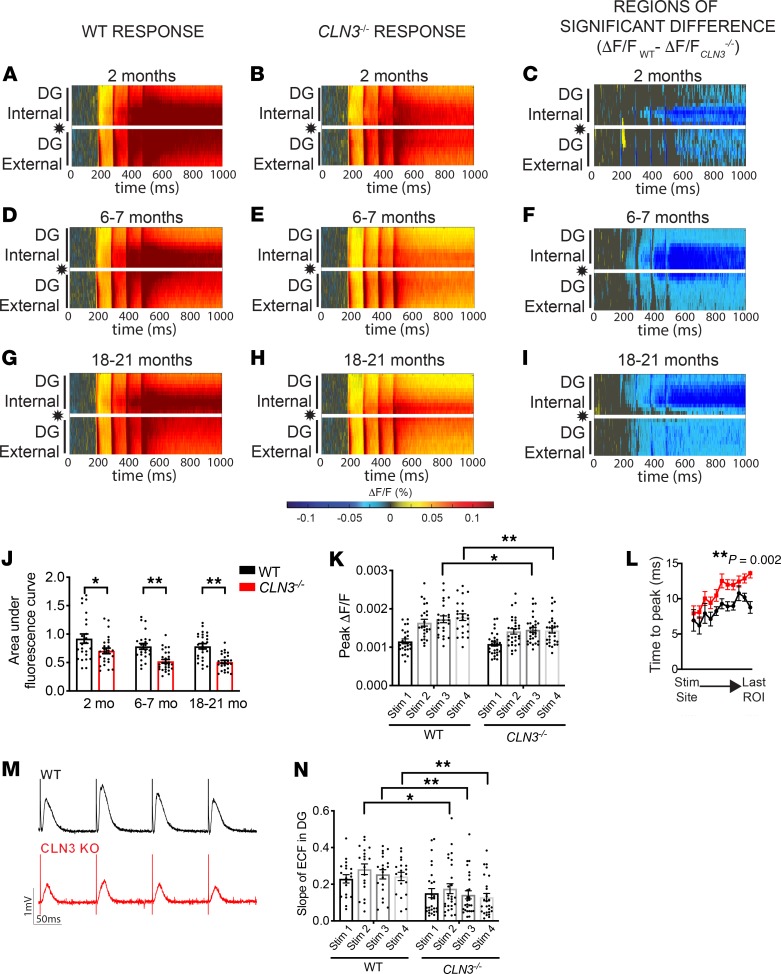
Figure 1. Activation of the DG after PP stimulation is significantly decreased in CLN3–/– mice by 2 months of age.
(A–I) Raster plots of average fluorescence change (ΔF/F; warm colors, excitation; cool colors, inhibition) over time (x axis) and location within the hippocampus (y axis). PP stimulation location indicated by star. (A) Stimulation of the PP in 2-month-old animals reveals robust excitation of the DG in WT mice. (B) CLN3–/– DG is hypoexcitable as compared with WT after PP stimulation. (C) WT vs. CLN3–/– rasters were compared using a permutation sampling method. Pixels with P > 0.05 are masked in gray. For regions of significance with P < 0.05, the difference in fluorescence change (ΔF/FWT – ΔF/FCLN3KO) is shown. (D–F) The CLN3–/– DG continues to be hypoexcitable at 6–7 months and (G–I) 18–21 months. (J) Quantification of total fluorescence change in the entire DG supports hypoexcitability in CLN3–/– mice (2-way ANOVA, followed by Tukey’s multiple-comparisons test). (K) Peak fluorescence is also decreased in CLN3–/– mice (1-way ANOVA, followed by Holm-Šídák multiple-comparisons test). (L) Signal propagation is slowed in the 2-month-old CLN3–/– DG, as measured by time to peak response in regions of interest moving from the stimulation site to the distal end of the DG (2-way ANOVA). (M and N) The magnitude and slope of the extracellular field response recorded during VSD experiments in 6-month-old WT and CLN3–/– DG supports hypoexcitability in CLN3–/– DG (1-way ANOVA, followed by Holm-Šídák multiple-comparisons test). For all panels: *P < 0.05, **P < 0.01. Group sizes (n = slices, N = mice): 2-month WT n = 24, N = 6; 2-month CLN3–/– n = 26, N = 5; 6- to 7-month WT n = 23, N = 5; 6- to 7-month CLN3–/– n = 30, N = 8; 18- to 21-month WT n = 25, N = 7; 18- to 21-month CLN3 n = 26, N = 7. For all graphs mean ± SEM shown.

