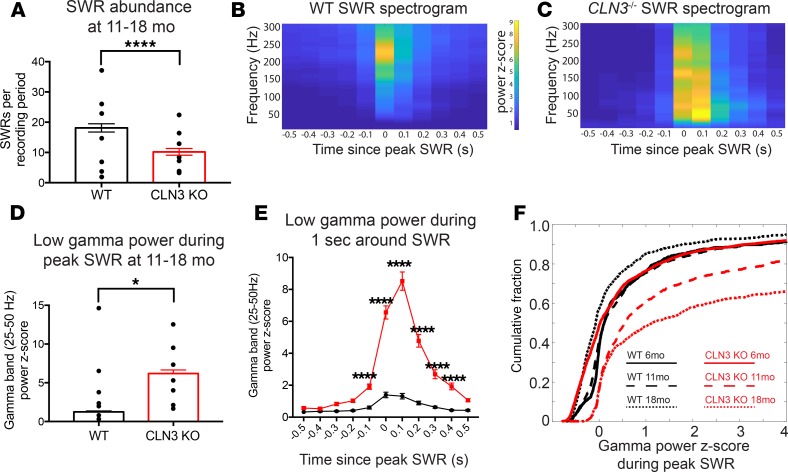
Figure 7. Like AD mouse models, late-stage CLN3–/– mice have fewer SWRs than WT. Ripples that do occur trigger an exaggerated gamma frequency response.
(A) Quantification of SWRs per 30-minute recording from the hippocampal EEGs of WT (shown in black) and CLN3–/– (shown in red) mice reveals decreased SWR abundance in CLN3–/– mice. Group sizes in A: WT n = 118 thirty-minute recordings, N = 7 mice; CLN3–/– n = 142 thirty-minute recordings, N = 7 mice. Bar graphs show mean ± SEM and SWR number from all recordings; black points show mean SWR abundance for each mouse. Statistical analysis was completed 2 ways (Mann-Whitney U test comparing the SWR number between all WT and CLN3–/– recording periods and 2-way ANOVA to capture variation because of both individual mice and genotype); both demonstrated a difference between genotypes with ****P < 0.0001. (B and C) Average spectrogram of the 1 second surrounding SWRs detected in WT and CLN3–/– hippocampus shows that in WT animals there is a brief increase in power in the ripple frequency band (150–250 Hz), while in CLN3–/– animals there is a prolonged increase in power in multiple frequency bands. (D) Peak power in the low gamma range after an SWR is increased in CLN3–/– mice as compared with WT. (E) Gamma power is increased in CLN3–/– (red) mice for several hundred milliseconds surrounding the peak SWR as compared with WT (black) (2-way ANOVA followed by Holm-Šídák multiple-comparisons test). Group sizes for D and E: WT n = 2059 SWRs, N = 7 mice; CLN3–/– n = 1363 SWRs, N = 7 mice. Bar graphs show mean ± SEM gamma power from all SWRs; black points show mean peak gamma power during SWRs by mouse. Statistical analysis was completed 2 ways: Mann-Whitney U testing comparing peak gamma power in all WT and CLN3–/– SWRs gave ****P < 0.0001; while 2-way ANOVA to capture variation because of both individual mice and genotype showed a genotype effect with *P = 0.03. (F) In CLN3–/– hippocampus, the cumulative fraction of SWRs triggering a high-power gamma frequency response increases with disease progression from 6 months (solid line, WT n = 1334 SWRs, CLN3–/– n = 2040 SWRs, N = 4 mice/genotype), to 11 months (large dashed line, WT n = 1114 SWRs, CLN3–/– n = 833 SWRs, N = 4 mice/genotype), to 18 months (small dashed line, WT n = 947 SWRs, CLN3–/– n = 942 SWRs, N = 3 mice/genotype).

