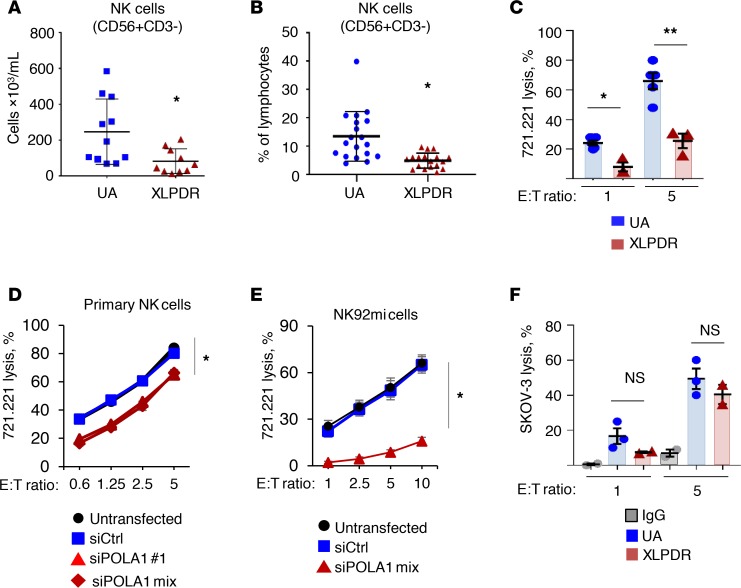
Figure 1. NK cell direct cytotoxicity is affected in XLPDR patients.
(A) Flow cytometry quantification of NK cells per milliliter in peripheral blood of XLPDR patients (P1–P5) and unaffected individuals (UA4–UA11). Horizontal bars represent the mean; error bars represent the SD. *P < 0.015, Student’s 2-tailed t test. Data are the aggregate from up to 3 independent measurements. (B) Flow cytometry quantification of NK cells in peripheral blood as a percentage of total lymphocytes. P1–P5 and UA1–UA12 are represented. Horizontal bars represent the mean; error bars represent the SD. *P < 0.0005, Student’s 2-tailed t test. Data are the aggregate of 7 independent measurements spanning up to 8 years. (C) NK cell direct cytotoxicity against 721.221 target cells was assessed using NK cells from unaffected controls (UA1, UA2, UA13) or XLDPR patients (P1 and P2), using effector/target (E/T) ratios of 1 and 5. Bars represent the mean; error bars represent the SEM. *P < 0.0065, and **P < 0.0001 by 2-way ANOVA. Data are the aggregate of 2 independent experiments. (D) NK cell direct cytotoxicity against the 721.221 target cell line was determined over the indicated E/T ratios. Primary NK cells obtained from 5 healthy donors (UA14–UA18) were subjected to POLA1 silencing using 2 siRNA duplexes or a pool of them. The data are representative of 2 independent experiments; error bars represent the SEM. *P < 0.0001 by 2-factor ANOVA comparing siPOLA1 samples against controls. Data are the aggregate of 5 independent experiments. (E) Same as D but using the tumor-derived NK cell line NK92mi. The data are representative of 3 independent experiments; error bars represent the SEM. *P < 0.0001 by 2-way ANOVA comparing siPOLA1 mix against control samples. Data are representative of 2 independent experiments. (F) Antibody-dependent cell cytotoxicity (ADCC) of NK cells from unaffected controls (UA8–UA10) and XLPDR patients (P1 and P2). SKOV-3 ovarian cancer cells treated with anti–human epidermal growth factor receptor 2 (anti-HER2) antibodies were used as the target cell line; cells incubated with control antibody (IgG) were used as a negative control. Bars represent the mean; error bars represent the SEM. NS, nonsignificant; P > 0.1 by 2-factor ANOVA comparing UA to XLPDR groups. Data are from a single experiment.

