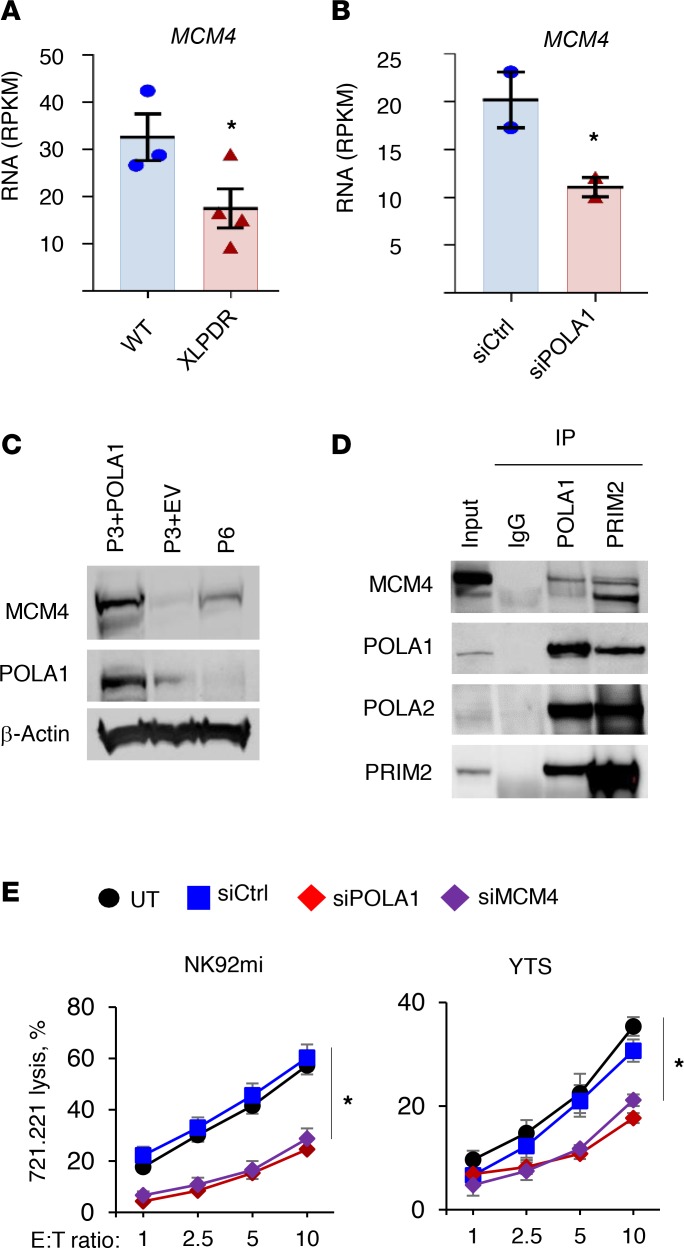
Figure 2. Pol-α/primase and the MCM complex are required for optimal NK cell function.
(A) Expression of MCM4 as determined by RNA-Seq analysis in unaffected (UA1) and XLPDR-derived immortalized dermal fibroblasts (XLPDR, P2 and P3). Bars represent the mean; error bars represent the SEM; *P < 0.05 by Student’s 1-tailed t test. Data are the average of 3 independent experiments. RPKM, reads per kilobase of transcript per million mapped reads. (B) Same as A, but comparing MCM4 expression in UA1 fibroblasts treated with siCtrl or siPOLA1. Bars represent the mean; error bars represent the SEM. *P < 0.05 by Student’s 1-tailed t test. Data are the average of 2 independent experiments. (C) Expression of the indicated proteins was determined by immunoblotting in immortalized dermal fibroblasts derived from an XLPDR patient (P3 + EV), isogenic “rescued” control line (P3 + POLA1), and a patient (P6) with a recently reported POLA1 mutation (c.328G>A). The Western blot is representative of 2 independent experiments. (D) HEK293T cell lysate was subjected to POLA1 or PRIM2 immunoprecipitation and then immunoblotted for MCM4. Nonspecific control antibody (IgG) was used as a negative control. The Western blot is representative of 2 independent experiments. (E) NK cell lines NK29mi (left) and YTS (right) were subjected to POLA1 or MCM4 silencing using corresponding siRNA. NK cell direct cytotoxicity against the 721.221 target cell line was determined over the indicated E/T ratios. Data represent the average of 3 experiments. Error bars represent the SEM. *P < 0.0001 by 2-way ANOVA comparing siPOLA1 or siMCM4 against siCtrl in each E/T ratio. Data are from a single experiment.

