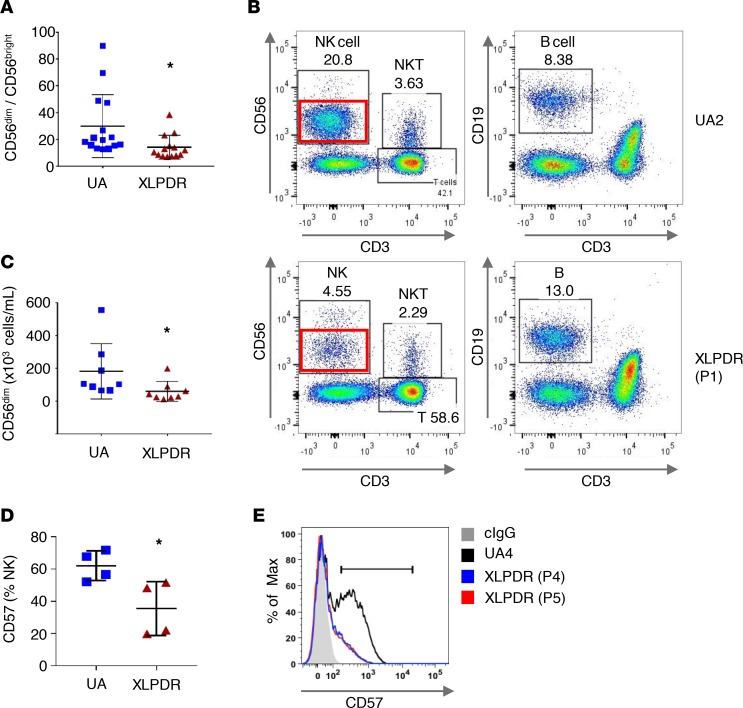
Figure 3. POLA1 deficiency affects NK cell maturation and direct cytotoxicity.
(A) Flow cytometry quantification of the CD56dim/CD56bright ratio in peripheral NK cells is significantly affected in XLPDR patients (P1–P5) compared with unaffected control (UA1–UA7, UA10, UA11). Horizontal bars represent the mean; error bars correspond to the SD; *P < 0.02 by Student’s 2-tailed t test. Data are the aggregate of 5 independent experiments. (B) Representative flow cytometry plots of white blood cell subpopulations in an unaffected individual (UA2) and an XLPDR patient (P1). CD56dim (stage V) NK cell subsets are highlighted by red rectangles. (C) Flow cytometry–based quantification of stage V CD56dim NK cells in unaffected individuals (UA4–UA7, U10, UA11) and XLPDR patients (P1–P5). Horizontal bars represent the mean; error bars correspond to the SD; *P < 0.04 by Student’s 1-tailed t test. Data are the aggregate of 2 independent experiments. (D) Flow cytometry–based quantification of stage VI CD57+ NK cells in unaffected individuals (UA1–UA4) and XLPDR patients (P1, P2, P4, P5). Horizontal bars represent the mean; error bars correspond to the SD; *P < 0.03 by Student’s 2-tailed t test. Data are the representative image of 3 independent experiments. (E) FACS analysis of CD56+CD3– NK cells depicting representative CD57 surface expression in an XLPDR proband (P4, P5) compared with an unaffected control (UA4).

