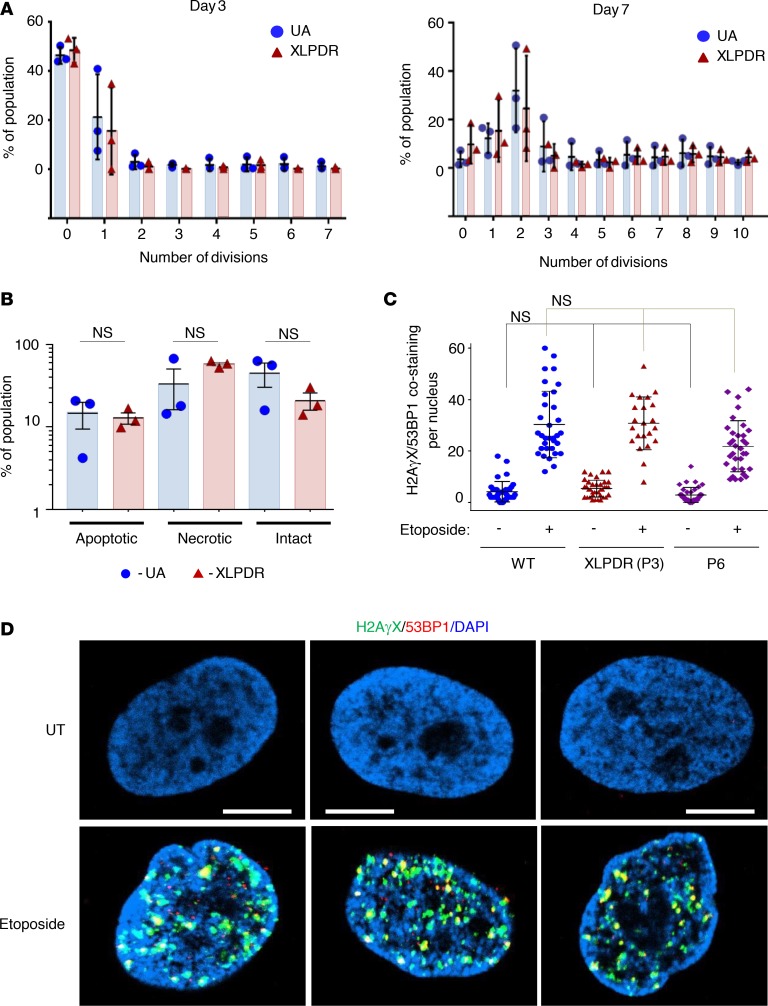
Figure 4. POLA1 does not affect cell cycle progression and DNA integrity.
(A) Flow cytometry analysis of NK cell proliferation (based on CFSE dilution) was performed on days 3 and 7 in NK cells isolated from unaffected individuals (UA4, UA5, UA8) and from XLPDR probands (P1, P2, P3). Error bars represent the SEM. XLPDR and UA groups are not different at every division number (P > 0.05 by 2-way ANOVA). Data are representative of 2 independent experiments. (B) Flow cytometry analysis of apoptosis and necrosis (based on annexin V staining) was performed on day 14 in proliferating NK cells as above. Data are the result of 1 experiment. Black bars indicate the mean and error bars represent the SD. (P > 0.05 by 2-way ANOVA.) (C) Quantification of the number of DNA-damaging events per nucleus (colocalized H2AγX and 53BP1 foci) is presented. Each dot represents a cell in each group. Bars correspond to the group average, and error bars correspond to the SD. NS, nonsignificant when compared to its corresponding control (P > 0.05 by 2-way ANOVA). (D) Representative images of DNA damage foci assessed by immunofluorescence staining and confocal microscopy imaging for nuclear H2AγX and 53BP1. Dermal fibroblasts from an XLPDR patient that were rescued for POLA1 expression (P3 + POLA1) were compared to an isogenic control line (P3 + EV) and to fibroblasts from P6. Staining at baseline and after etoposide treatment (1 μM, 5 hours) is shown. Scale bar: 2 μm. Representative images were derived from 2 independent experiments.

