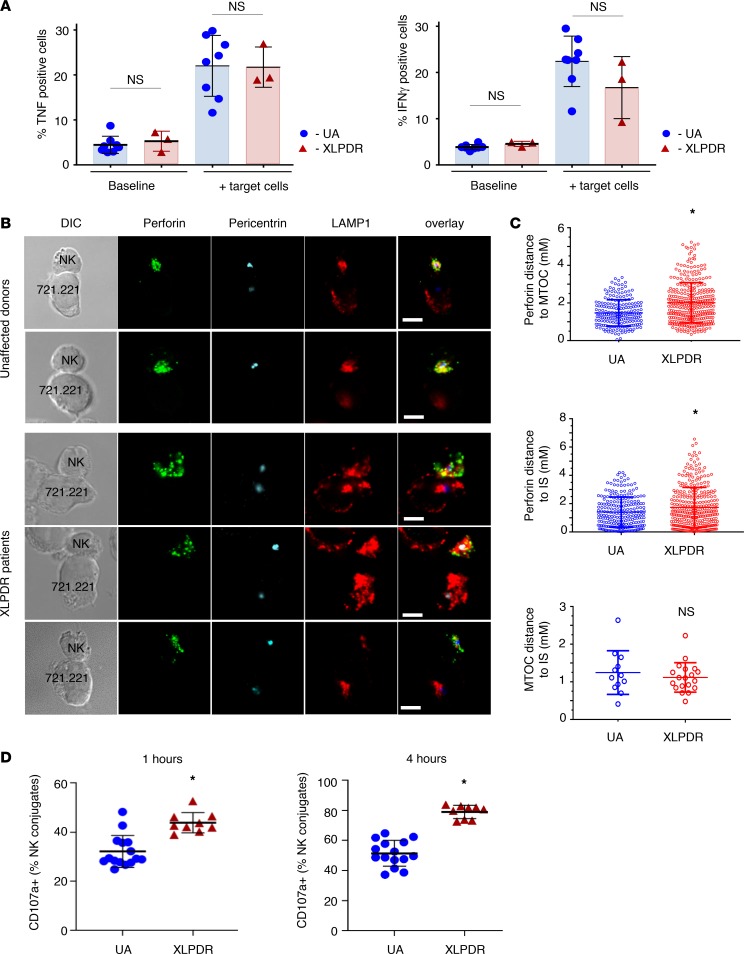
Figure 5. POLA1 deficiency affects polarization of lytic granules in activated NK cells.
(A) Flow cytometry analysis of TNF (left) and IFN-γ (right) expression in NK cells, derived from unaffected control individuals (UA1–UA3) and XLPDR patients (P1, P2). Data are derived from 1 experiment; error bars correspond to the SD. NS, nonsignificant (P > 0.05, 2-way ANOVA). (B) Lytic granule and MTOC complex mobilization in NK cells was examined by immunofluorescence staining and confocal microscopy after activation with 721.221 target cells. Perforin (green), pericentrin (MTOC marker; blue), and LAMP1 (red) are depicted. The dashed lines indicate the position of the cell-cell contact site. Scale bars: 5 μm. Representative images of cells from healthy donors and patients with XLPDR are presented. (C) Quantification of confocal microscopy data from B. Distances from MTOC to perforin granules (top), perforin granules to the immunological synapse (center), and MTOC to the immunological synapse (bottom) are presented. Analysis was done using all available images from XLPDR NK cells (n = 19) and unaffected NK cells (n = 12). *P < 0.05; NS, not significant (P > 0.05), by 2-tailed Student’s t test. (D) LAMP1 degranulation in NK target conjugates. NK cells were derived from unaffected individuals (UA6, UA7, UA11, UA12) and XLPDR patients (P3–P5) and incubated for 1 or 4 hours with target 722.221 cells, and surface expression of CD107a was assessed by flow cytometry. Data are the representative image of 3 independent experiments. Horizontal bars represent the mean; error bars correspond to the SD; *P < 0.0001 by Student’s 2-tailed t test.

