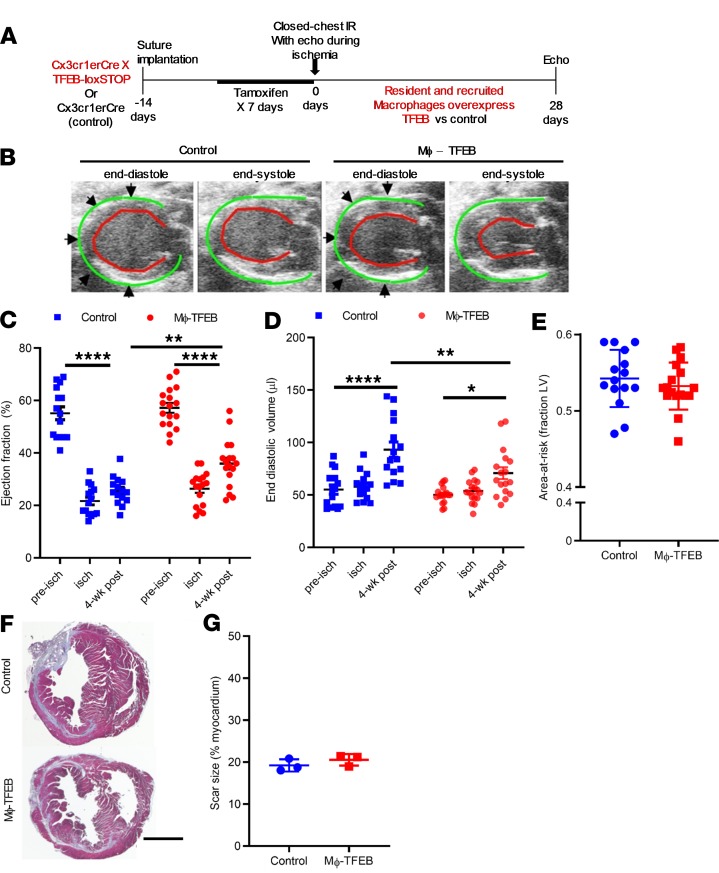
Figure 3. Mϕ-TFEB attenuates ventricular dysfunction after ischemia/reperfusion.
(A) Schematic detailing closed-chest ischemia/reperfusion (IR) protocol in control versus Mϕ-TFEB mice. (B) Representative 2D-echocardiographic images from control versus Mϕ-TFEB 4 weeks after IR. Green lines highlight the epicardial border; red lines demarcate the endocardium. (C) Ejection fraction (%, y axis) in control versus Mϕ-TFEB prior to (pre-isch), during (isch), and 4 weeks after IR injury. Controls, n = 15; Mϕ-TFEB, n = 17. 2-way ANOVA with multiple comparisons (Tukey’s t test). (D) End diastolic volume in mice modeled as in B. (E) Area-at-risk (y axis) in mice modeled as in B. Student’s t test. (F and G) Representative Masson’s trichrome stained cardiac tissue (F) from control and Mϕ-TFEB hearts 4 weeks after IR, with quantification of scar size (G) and 2-way Student’s t test. Scale bar = 1 mm. n = 3/group. Individual data points with mean and standard error are shown on each graph. *P < 0.05; **P < 0.01; ****P < 0.0001

