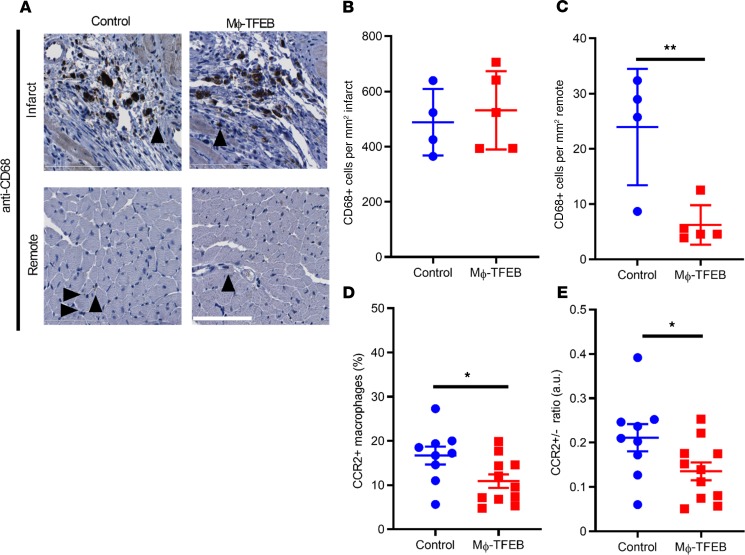
Figure 4. Mϕ-TFEB alters inflammatory cell composition after ischemia/reperfusion in the myocardium.
(A) Representative anti-CD68 stained (black arrows) image in infarcted and remote myocardium with hematoxylin counterstaining. Scale bar = 100 μm. (B and C) Quantification of CD68+ cells in infarct and remote myocardium in control versus Mϕ-TFEB mice 28 days after ischemia/reperfusion (IR). n = 4, control; n = 5 Mϕ-TFEB. (D) Percentage of CCR2+ macrophages assessed by flow cytometry 28 days after IR in control (n = 9) versus Mf-TFEB (n = 11) mice. (E) Ratio of CCR2+/CCR2– macrophages in control (n = 9) versus Mϕ-TFEB (n = 11) mice 28 days after IR. Individual data points with mean and standard error are shown on each graph. *P < 0.05; **P < 0.01 by Student’s t test.

