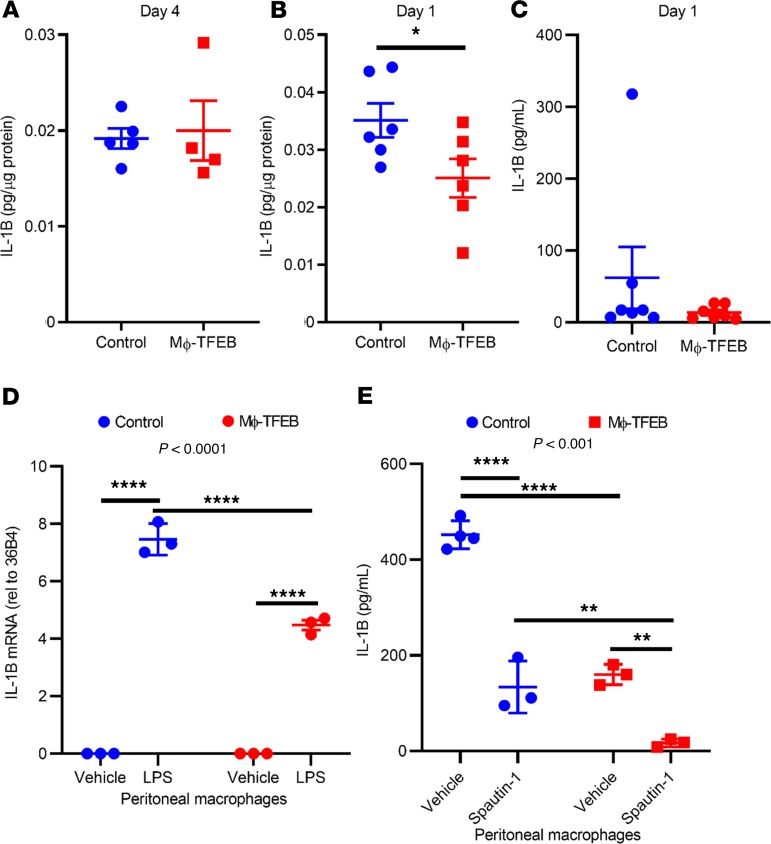
Figure 6. Mϕ-TFEB attenuates IL-1β secretion independent of autophagy.
(A and B) IL-1β myocardial protein levels at day 4 (A, n = 5 controls; n = 4 Mϕ-TFEB) and at day 1 (B, n = 6 controls; n = 6 Mϕ-TFEB) after ischemia/reperfusion (IR). (C) Serum IL-1β levels at day 1 after IR. n = 7/group, Student’s t test for A–C. (D) IL-1β mRNA from peritoneal macrophages (pMACs) stimulated with LPS for 4 hours, n = 3/group, 2-way ANOVA with Tukey’s t test for multiple comparisons; interaction P value shown at top of graph. (E) IL-1β protein levels in supernatants from pMACs pretreated with diluent or Spautin-1 (10 μM) for 30 minutes followed by stimulation with LPS (2 hours) and ATP (30 minutes). n = 3–4 cell replicates/time point, 2-way ANOVA with Tukey’s t test for multiple comparisons and interaction P value shown on graph. For D and E only, representative data are shown with cellular replicates from cells isolated on a single day; all peritoneal macrophage experiments were repeated at minimum 3 times on separate days; individual data points with mean and standard error are shown on each graph. *P < 0.05; **P < 0.01; ***P < 0.001; ****P < 0.0001.

