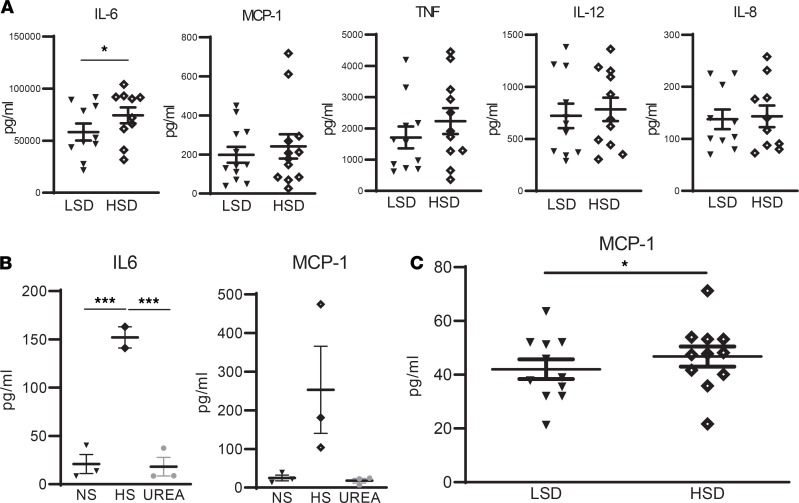
Figure 3. Effect of salt on cytokines.
(A) Whole blood samples after LSD and HSD were challenged with LPS (24 h with 10 ng/mL) and cytokines were quantified by ELISA. (B) Monocytes of independent healthy donors were stimulated for 24 h in RPMI + 10% FCS + 1% PenStrep in the presence of normal salt (NS), high salt (HS), or 80 mM urea as tonicity control. Then, cytokine secretion was quantified by ELISA. (C) Plasma samples after LSD and HSD were analyzed for MCP-1 and IL-6 by ELISA. IL-6 was below the detection threshold. For all analyses, ELISA was performed in accordance with the supplier’s protocols (Invitrogen). NS, ([Na+] = 139 mM); HS, ([Na+] = 179 mM). LSD, low-salt diet. HSD, high-salt diet. Values represent mean ± SEM of n = 11 healthy male volunteers (A and C) and n = 3 healthy male donors (B). Data tested using paired t test (A and C) or a 1-way ANOVA (B). *P < 0.05; ***P < 0.001.

