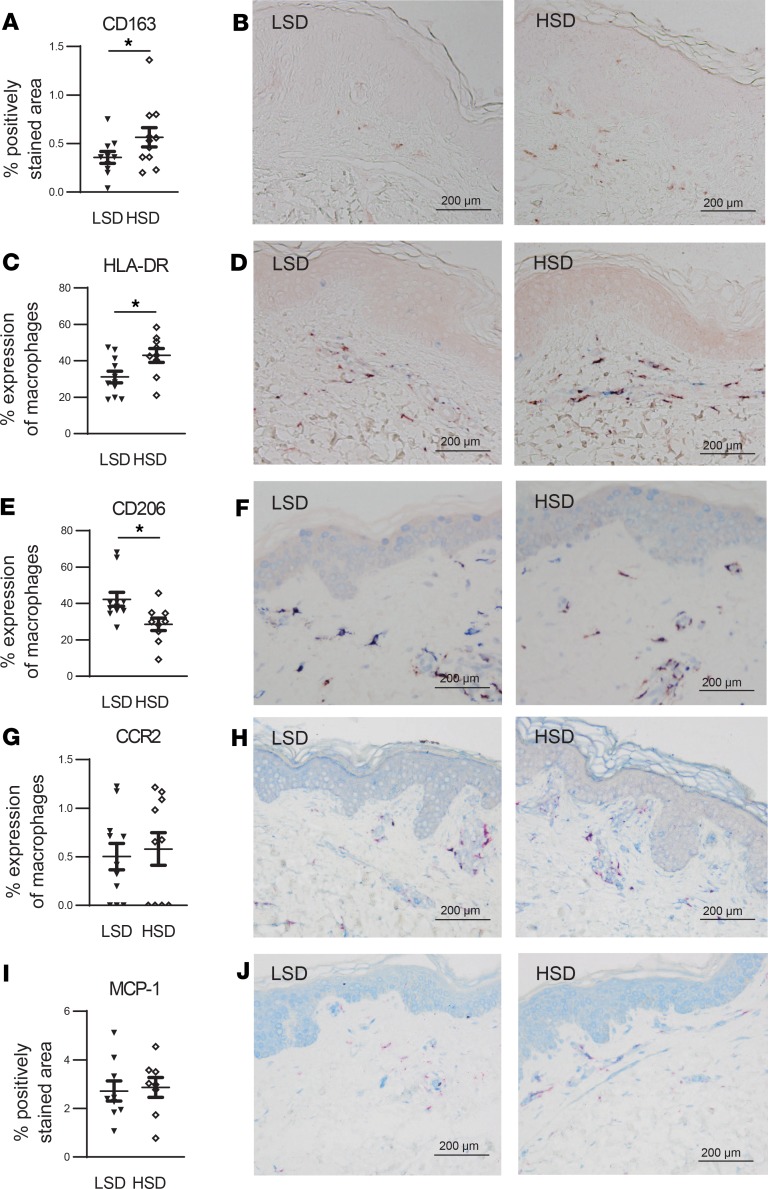
Figure 5. HSD increases skin macrophage content with signs of a more proinflammatory and less antiinflammatory phenotype.
(A and B) To assess total skin macrophage content, sections were stained with anti-CD163 (red). Quantification of total macrophage content was expressed as the percentage of the total dermal area of the section that was positively stained for anti-CD163 (A). Anti-CD163 was favored above anti-CD68, since our pilot experiments showed that CD163 proved to be a more consistent macrophage marker than CD68 (Supplemental Figure 1), which is in line with the observations of 2 other research groups (51, 52). (C–H) To assess expression of proinflammatory and antiinflammatory macrophage markers, sections were stained with anti-CD163 (red) and either anti–HLA-DR (blue) (C and D), anti-CD206 (blue) (E and F), or anti-CCR2 (blue) (G and H). Since HLA-DR, CD206, and CCR2 can be expressed by other cells than macrophages, we only took into account the positively stained area of the concerning marker that was also positive for the macrophage marker anti-CD163. Quantification of the total expression of the several markers by macrophages was expressed as the percentage of positively stained area for anti-CD163 that was also positively stained for the concerning marker. (I and J) To assess skin expression of MCP-1, section were stained with anti–MCP-1 (blue) and anti-CD163 (red). Quantification of skin expression of MCP-1 was expressed as the total dermal area of the section that was positively stained for MCP-1 (I). LSD, low-salt diet. HSD, high-salt diet. Scale bar: 200 μm. Values represent mean ± SEM of n = 9–11 healthy male volunteers. Data are tested using a paired t test. *P < 0.05.

